Tag Archives: Reports and Studies

184 New Packaging Industry Projects Drive $17B+ Capital Pipeline in August 2026

The 184 projects break into 181 leads with packaging equipment flagged in project opportunity alert

JACKSONVILLE, Fla., Sept. 22, 2026 (SEND2PRESS NEWSWIRE) — Industrial SalesLeads tracking for August 2026 identified 184 capital projects where packaging equipment is a procurement opportunity or where the operating company is a packaging manufacturer. Spanning more than 30 states and Canadian provinces, these projects range from single-facility equipment upgrades to multi-billion-dollar campus construction, with 20 projects valued at $100 million or more and 137 in planning and design, representing procurement conversations yet to be won.
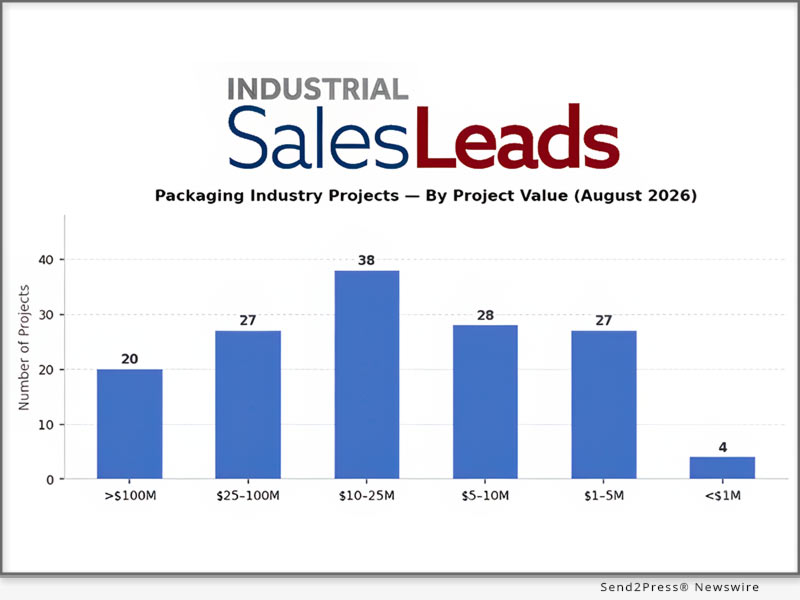
184 New Packaging Industry Projects Drive $17B+ Capital Pipeline in August 2026
Image caption: 184 New Packaging Industry Projects Drive $17B+ Capital Pipeline in August 2026.

The 184 projects break into 181 leads with packaging equipment flagged in project opportunity alerts. They define a deep and actionable pipeline for packaging equipment suppliers across the U.S. and Canadian manufacturing sector.

The following are selected highlights on new Packaging industry construction.

Packaging – By Industry Segment

  • General Manufacturing – 140 New Projects
  • Food & Beverage Processing – 25 New Projects
  • Packaging Manufacturers – 9 New Projects
  • Pharmaceutical / Cannabis Processing – 7 New Projects
  • Distribution & Logistics – 2 New Projects
  • Refrigerated Facilities – 1 New Project

Packaging – By Project Scope/Activity

  • Equipment Upgrades – 115 New Projects
  • Renovations – 73 New Projects
  • Expansions – 71 New Projects
  • New Construction – 41 New Projects
  • Relocations – 16 New Projects

Packaging – By Project Stage

  • Planning/Design – 137 New Projects
  • Approval – 36 New Projects
  • Conceptual – 11 New Projects

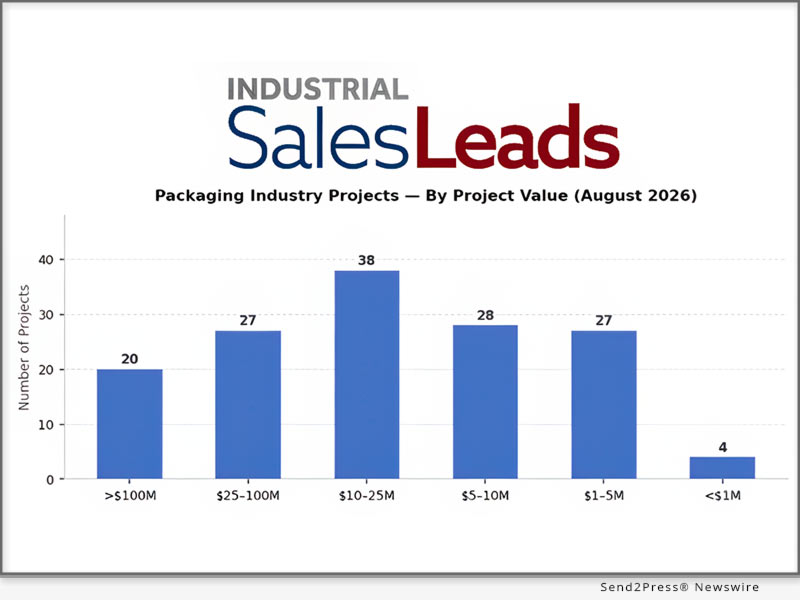
Packaging – By Project Value

> $100 Million – 20 New Projects

$25 – 100 Million – 27 New Projects

$10 – 25 Million – 38 New Projects

$5 – 10 Million – 28 New Projects

$1 – 5 Million – 27 New Projects

< $1 Million – 4 New Projects

Packaging – By Project Location (Top 10 States)

  • Ohio – 12
  • New York – 12
  • Pennsylvania – 11
  • California – 10
  • Indiana – 10
  • Massachusetts – 8
  • Wisconsin – 8
  • Alabama – 7
  • North Carolina – 7
  • Tennessee – 7

LARGEST PLANNED PROJECT

During the month of August, our research team identified 20 new packaging-adjacent industrial facility construction projects with an estimated value of $100 million or more.

The largest project is owned by SpaceX, who is planning to invest $17 billion for the construction of a 100 million sf manufacturing, processing, and warehouse campus in GEORGETOWN, TX. Packaging equipment is flagged as a procurement opportunity for the project. They are currently seeking approval for the project.

Top 10 Tracked Packaging-Adjacent Projects

TEXAS:

Aerospace company is planning to invest $17 billion for the construction of a 100 million sf manufacturing, processing, and warehouse campus in GEORGETOWN, TX. They are currently seeking approval for the project.

CONNECTICUT:

Submarine mfr. is planning to invest $5 billion for the expansion, renovation, and equipment upgrades on their manufacturing complex in GROTON, CT. They are currently seeking approval for the project.

OREGON:

Semiconductor equipment mfr. is planning to invest $1.5 billion for the expansion of their manufacturing campus in TUALATIN, OR by 210,000 sf. They are currently seeking approval for the project.

COLORADO:

Tobacco products processor is planning to invest $1.2 billion for the expansion and equipment upgrades on their processing facility in AURORA, CO. They are currently seeking approval for the project.

NORTH CAROLINA:

Wire and cable mfr. is planning to invest $1 billion for the expansion and equipment upgrades on their manufacturing facility in CLAREMONT, NC. Completion is slated for 2028.

ARIZONA:

Industrial gas mfr. is planning to invest $1 billion for the expansion and equipment upgrades on their processing complex in PHOENIX, AZ. They are currently seeking approval for the project.

INDIANA:

Construction equipment mfr. is planning to invest $890 million for the expansion and equipment upgrades on their manufacturing facility in LAFAYETTE, IN. They are currently seeking approval for the project.

OHIO:

Pharmaceutical company is planning to invest $750 million for the expansion and equipment upgrades on their manufacturing facilities in BLUE ASH, OH and HAMILTON, OH.

OREGON:

Biotechnology company is planning to invest $750 million for the expansion of their processing and manufacturing campus in HILLSBORO, OR. Completion is slated for 2031.

OHIO:

Sterilization products manufacturer and services company is planning to invest $600 million for the construction of a 600,000 sf processing and distribution campus in SANFORD, NC. Completion is slated for late 2028.

About Industrial SalesLeads, Inc.

Since 1959, Industrial SalesLeads, based in Jacksonville, FL is a leader in delivering industrial capital project intelligence and prospecting services for sales and marketing teams to ensure a predictable and scalable pipeline. Our Industrial Market Intelligence, IMI, identifies timely insights on companies planning significant capital investments such as new construction, expansion, relocation, equipment modernization and plant closings in industrial facilities.

Each month, our team provides hundreds of industrial reports within a variety of industries.

Website: https://www.salesleadsinc.com/

Blog: https://www.salesleadsinc.com/blog/

NEWS SOURCE: Industrial SalesLeads Inc


This press release was issued on behalf of the news source (Industrial SalesLeads Inc), who is solely responsible for its accuracy, by Send2Press Newswire. Image, if any, was provided by the news source and not this website or the wire service. Information is believed accurate, as provided by the news source, but is not guaranteed.

To view the original story, visit: https://www.send2press.com/wire/184-new-packaging-industry-projects-drive-17b-capital-pipeline-in-august-2026/

Copr. © 2026 Send2Press® Newswire, Calif., USA. -- REF: S2P STORY ID: S2P138354 NOREL-3B
 

Analysis: iEmergent’s 2025 U.S. mortgage forecasts closely track HMDA actuals

Precision down to the census tract gives lenders a dependable edge for staffing, expansion and marketing decisions well before final HMDA data arrives

DES MOINES, Iowa, Sept. 16, 2026 (SEND2PRESS NEWSWIRE) — iEmergent, a forecasting and advisory services firm for the financial services, mortgage and real estate industries, today released a new analysis validating its 2025 forecasts against actual Home Mortgage Disclosure Act (HMDA) data. The analysis, which uses final 2025 HMDA data released by the Federal Financial Institutions Examination Council on June 23, 2026, spans every geographic level from national down to individual census tracts, showing the strength of iEmergent’s bottom-up forecasting approach.

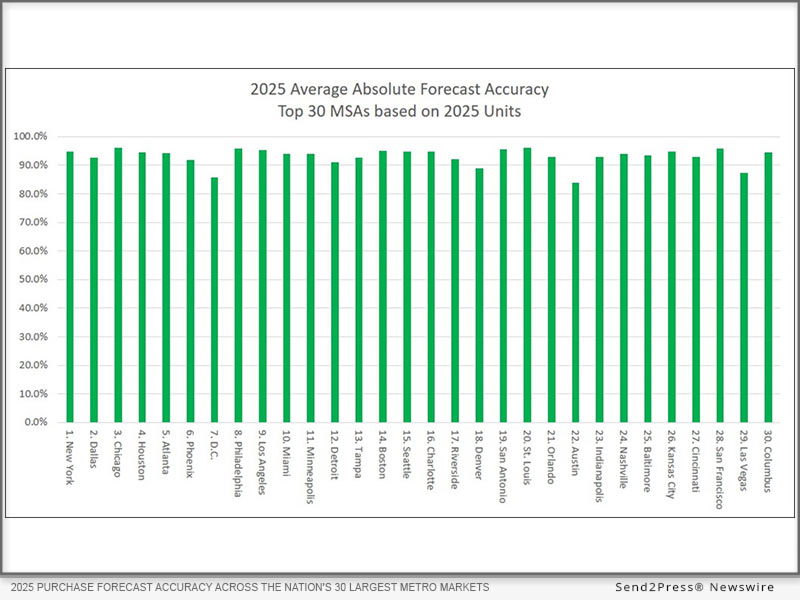
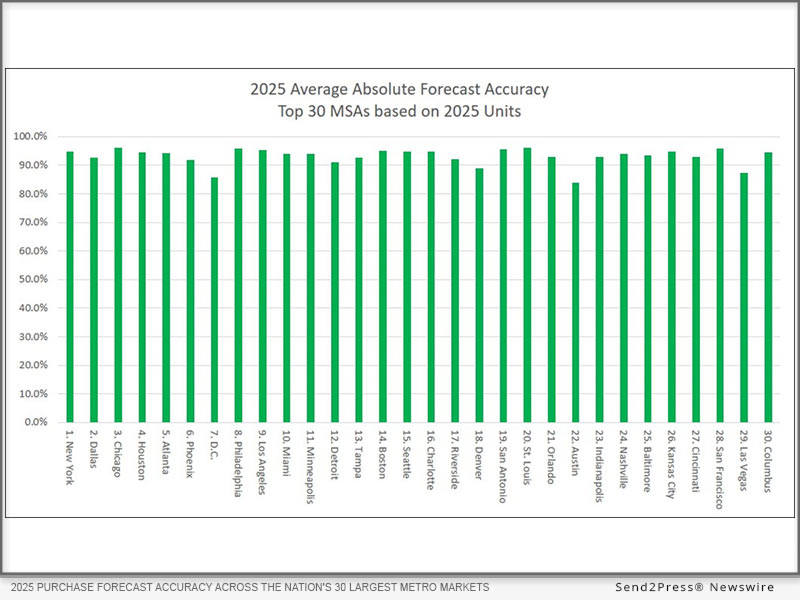
2025 PURCHASE FORECAST ACCURACY ACROSS THE NATION'S 30 LARGEST METRO MARKETS, MEASURED AGAINST HMDA ACTUALS
Image caption: 2025 PURCHASE FORECAST ACCURACY ACROSS THE NATION’S 30 LARGEST METRO MARKETS, MEASURED AGAINST HMDA ACTUALS.

The accuracy of iEmergent’s 2025 purchase loan forecasts for the nation’s top 30 largest metropolitan statistical areas (MSAs) averaged well above 90% when compared against 2025 HMDA actuals. That figure reflects absolute forecast accuracy, which cannot exceed 100%.

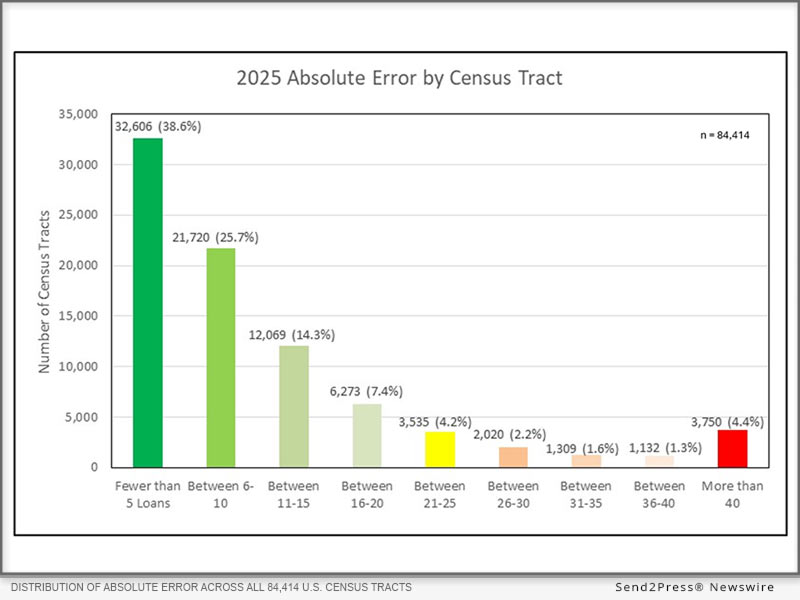
Looking at per-tract loan error by individual census tract, iEmergent’s 2025 forecast was within 10 loans of actual volume in more than 64.3% of the nation’s 84,414 census tracts. Widening that margin to 15 loans, the forecast was accurate for 78.6% of all tracts.

DISTRIBUTION OF ABSOLUTE ERROR ACROSS ALL 84,414 U.S. CENSUS TRACTS FOR 2025 PURCHASE LOANS
Image caption: DISTRIBUTION OF ABSOLUTE ERROR ACROSS ALL 84,414 U.S. CENSUS TRACTS FOR 2025 PURCHASE LOANS.

“Lenders need a dependable line of sight into where mortgage opportunity is forming, market by market — not months after the fact, once HMDA data finally confirms it, but early enough to guide decisions on staffing, branch locations, marketing spend and growth strategy for the year ahead,” iEmergent CEO Laird Nossuli said. “That’s exactly what iEmergent’s proprietary, bottom-up model is built to deliver.”

iEmergent also validated the accuracy of its forecasts against actual HMDA data at the borrower race and ethnicity level. Segment-level accuracy is calculated as the ratio of forecast to actual loan volume, which reflects both the size and direction of the forecast error. A figure above 100% indicates the forecast slightly exceeded actual volume; a figure below 100% indicates it fell short. For 2025, the company’s fourth-quarter 2024 forecast produced the following national-level accuracy rates by borrower segment:

  • Asian borrowers: 107.3% accuracy
  • Black borrowers: 96.3% accuracy
  • Hispanic borrowers: 90.5% accuracy
  • Native American and Pacific Islander borrowers: 83.8% accuracy
  • Non-Hispanic white borrowers: 89.4% accuracy

iEmergent’s forecasts are built on two core concepts: the Purchase Mortgage Generation Rate, which measures the rate at which an individual market produces purchase mortgages, and the Homebuyer Pool, the number of households ready, willing and able to buy a home in a given year. Together, these replace traditional top-down, supply-side forecasting models with a demand-driven approach rooted in how households actually behave. A full overview of iEmergent’s forecasting methodology is available at https://www.iemergent.com/insights/mortgage-opportunity-forecasting.

ABOUT IEMERGENT

Founded in 2000, iEmergent provides mortgage lending forecasts and analytics to the lending, housing and real estate industries. The company offers an extensive variety of forecast and market intelligence products, including Mortgage MarketSmart, a visualization tool that helps lenders quantify how mortgage markets will change. For more information, visit https://www.iemergent.com.

Tags: @iEmergent

Media Kit (PDF): https://www.iemergent.com/docs/default-source/default-document-library/presskit_digitallinked.pdf

NEWS SOURCE: iEmergent


This press release was issued on behalf of the news source (iEmergent), who is solely responsible for its accuracy, by Send2Press Newswire. Image, if any, was provided by the news source and not this website or the wire service. Information is believed accurate, as provided by the news source, but is not guaranteed.

To view the original story, visit: https://www.send2press.com/wire/analysis-iemergents-2025-u-s-mortgage-forecasts-closely-track-hmda-actuals/

Copr. © 2026 Send2Press® Newswire, Calif., USA. -- REF: S2P STORY ID: S2P138244 NOREL-3B
 

LinkedIn Activity Predicts Revenue More Than Website Traffic, shows 42DM’s GTM Benchmark Research into 100 B2B AI Companies

A new study of 100 AI infrastructure companies maps the GTM signals that correlate with revenue, finding that audience-building and trust infrastructure outperform traffic volume across every GTM motion

TENAFLY, N.J., Sept. 16, 2026 (SEND2PRESS NEWSWIRE) — 42DM, a B2B tech marketing agency specializing in go-to-market strategy for AI and SaaS companies, recently released “From Traffic to Pipeline: GTM Lessons from 100 Top AI Products,” a benchmark study mapping which channels and signals correlate with revenue across 100 leading AI infrastructure companies.

42DM's 2026 GTM Benchmark Report, "From Traffic to Pipeline: GTM Lessons from 100 Top AI Products."
Image caption: 42DM’s 2026 GTM Benchmark Report, “From Traffic to Pipeline: GTM Lessons from 100 Top AI Products.”

The research was supervised by Kate Vasylenko, Co-Founder and CEO of 42DM. The focus on AI infrastructure was deliberate: the niche is developing at a pace that makes GTM cause-and-effect visible far faster than in mature categories, where market positions have been locked in for years.

“In a market this dynamic, you can actually watch companies rise or stall based on their GTM choices,” said Vasylenko. “That makes AI infrastructure a much cleaner lens for understanding which activities predict revenue and which ones just feel like progress.”

WHAT THE RESEARCH EXAMINES

The study analyzed more than 40 signals across 11 dimensions, including LinkedIn distribution, organic and AI search visibility, trust infrastructure, paid channels, and founder brand, using Spearman rank correlations against revenue outcomes.

Among the findings: the channel with the strongest controllable correlation to revenue is one most teams treat as secondary. Trust infrastructure outperforms raw traffic volume. And the early data on AI search visibility already shows a measurable signal, despite referral volumes still being modest.

On paid channels, the research surfaces meaningful differences between display, social, and search, with results that may prompt some teams to reconsider where their paid budget is working hardest.

“The patterns are consistent enough that we feel confident saying: the companies growing fastest in this space are building specific things, in a specific order,” Kate said. “The research shows what those things are.”

WHY AI INFRASTRUCTURE

AI infrastructure was selected because top performers in the niche compete for similar buyers and face similar GTM challenges without directly competing with each other. That structure allows clean comparisons across GTM approaches. The speed of the market means the data reflects recent strategic choices rather than positions built over a decade, making the correlations more actionable for companies building their GTM motion today.

ACCESS THE RESEARCH

The full report is available at 42dm.net/resource/downloads/gtm-benchmark-research/

It includes an interactive company explorer, GTM signal breakdowns, correlations segmented by GTM motion and company maturity, and a personalized audit checklist. Teams looking to benchmark their own GTM motion against the dataset can book a free review at 42dm.net/gtm-review-us/

METHODOLOGY

The benchmark covers 100 AI infrastructure companies selected to represent top performers within the niche. Data was collected across LinkedIn, Similarweb, Ahrefs, G2, GitHub, analyst databases, and proprietary AI visibility tools. All correlations are reported as Spearman rank coefficients.

ABOUT 42DM

42DM is a B2B tech marketing agency that helps AI companies, SaaS platforms, cybersecurity firms, and fintech brands build measurable go-to-market engines. The agency’s services span demand generation, inbound marketing, AI search optimization (AEO), account-based marketing (ABM), martech, and PPC. 42DM works with companies at Series A through the growth stage and publishes original research to help marketing leaders make data-driven GTM decisions.

Media contact: marketing@42dm.net

MULTIMEDIA:\

IMAGE link for media: https://www.Send2Press.com/300dpi/26-0915-s2p-42dmrep-300dpi.webp

Image caption: 42DM’s 2026 GTM Benchmark Report, “From Traffic to Pipeline: GTM Lessons from 100 Top AI Products.”

NEWS SOURCE: 42DM


This press release was issued on behalf of the news source (42DM), who is solely responsible for its accuracy, by Send2Press Newswire. Image, if any, was provided by the news source and not this website or the wire service. Information is believed accurate, as provided by the news source, but is not guaranteed.

To view the original story, visit: https://www.send2press.com/wire/linkedin-activity-predicts-revenue-more-than-website-traffic-shows-42dms-gtm-benchmark-research-into-100-b2b-ai-companies/

Copr. © 2026 Send2Press® Newswire, Calif., USA. -- REF: S2P STORY ID: S2P138206 NOREL-3B
 

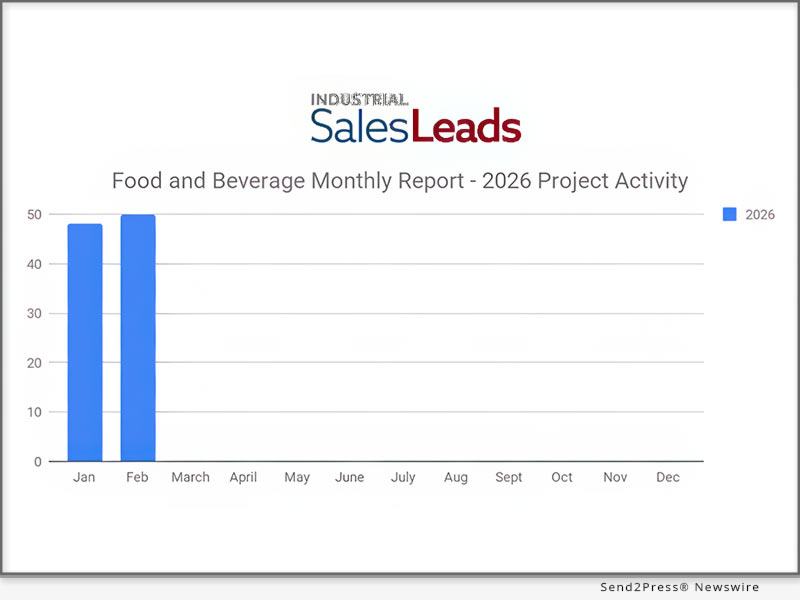
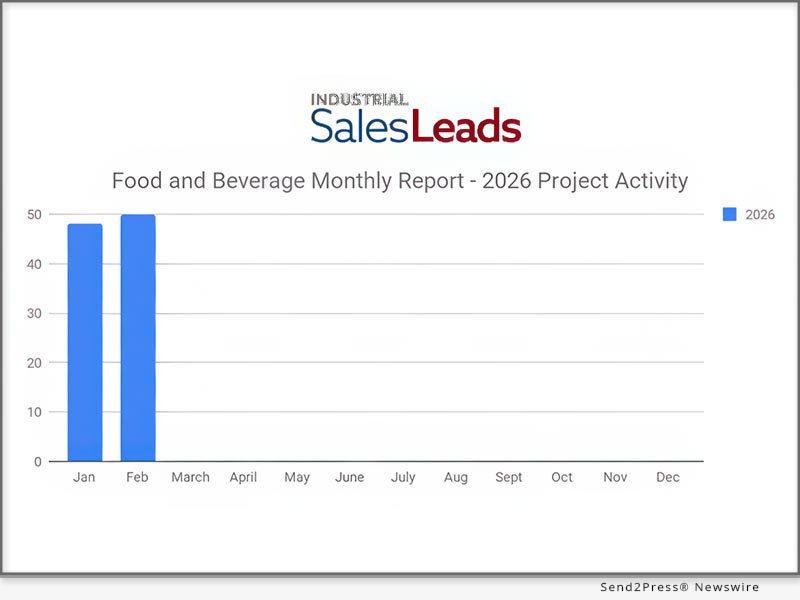
Food and Beverage Sector Surges to Second-Highest Month of 2026 with 63 New Planned Projects in August

The Firm's research team confirmed 63 new planned projects in the Food and Beverage sector during August, marking a strong rebound from July's 51 projects

JACKSONVILLE, Fla., Sept. 15, 2026 (SEND2PRESS NEWSWIRE) — Industrial SalesLeads announced today the August 2026 results for its planned capital project spending report for the Food and Beverage industry, tracking North American facility expansions, new plant construction, and significant equipment modernization projects.

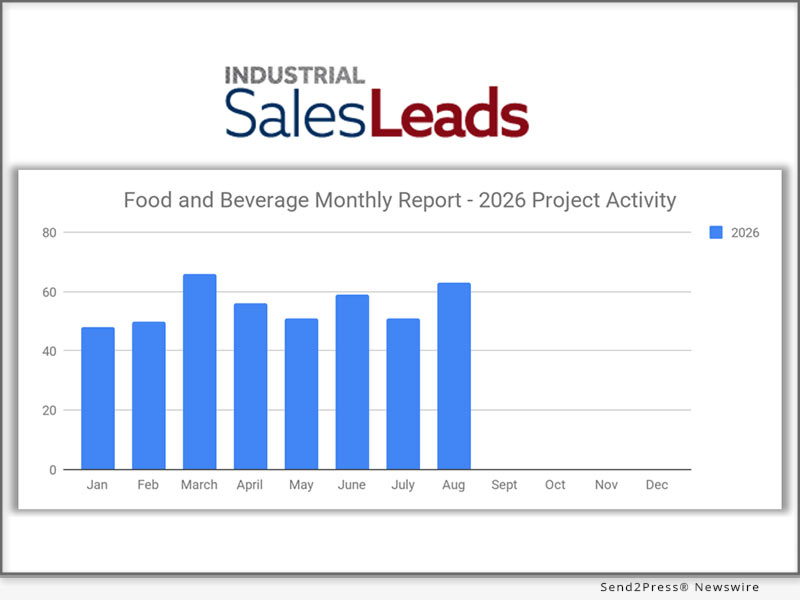
Food and Beverage Sector Surges to Second-Highest Month of 2026 with 63 New Planned Projects in August
Image caption: Food and Beverage Sector Surges to Second-Highest Month of 2026.

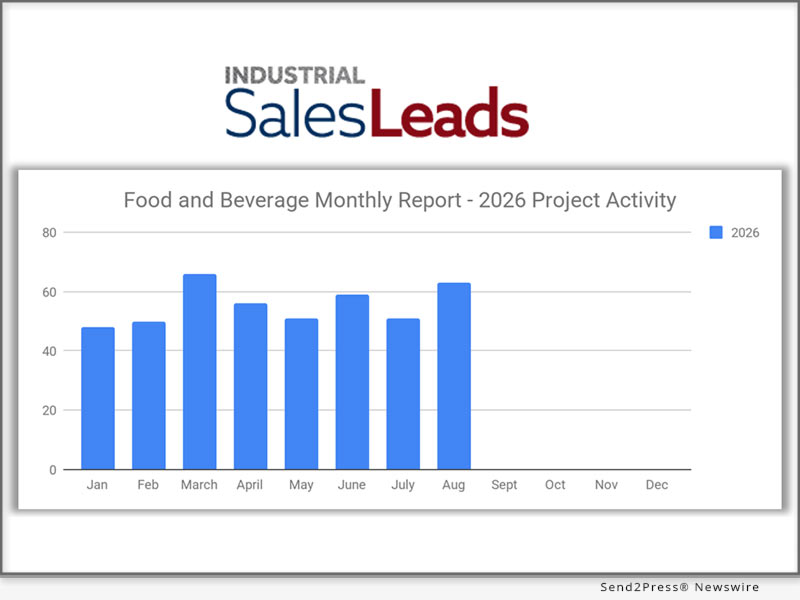
The Firm’s research team confirmed 63 new planned projects in the Food and Beverage sector during August, marking a strong rebound from July’s 51 projects and the second highest month of 2026, trailing only March’s peak of 66 projects. After a mid-year softening through April, May, and July, August’s surge signals renewed momentum in the sector, with activity led by processing facilities at 43 new projects and distribution and industrial warehouse at 28 new projects.

The following are selected highlights on new Food and Beverage industry construction news.

Food and Beverage Project Type

  • Processing Facilities – 43 New Projects
  • Distribution and Industrial Warehouse – 28 New Projects

Food and Beverage Project Scope/Activity

  • New Construction – 17 New Projects
  • Expansion – 19 New Projects
  • Renovations/Equipment Upgrades – 29 New Projects
  • Plant Closing – 10 New Projects

Food and Beverage Project Location (Top 10 States)

  • New York – 7
  • California – 6
  • Pennsylvania – 6
  • Kentucky – 4
  • Minnesota – 3
  • New Jersey – 3
  • Colorado – 2
  • Illinois – 2
  • Indiana – 2
  • Iowa – 2

Largest Planned Project

During the month of August, our research team identified 5 new Food and Beverage facility construction projects with an estimated value of $100 million or more.

The largest project is owned by Philip Morris International, who is planning to invest $1.2 billion for the expansion and equipment upgrades on their processing facility in AURORA, CO. They are currently seeking approval for the project.

Top 10 Tracked Food and Beverage Projects

MINNESOTA:

Cheese mfr. is planning to invest $135 million for a 120,000 sf expansion and equipment upgrades on their processing and warehouse facility at 13200 County Road 51 in BONGARDS, MN. They are currently seeking approval for the project. Construction is expected to start in late 2026, with completion slated for early 2028.

LOUISIANA:

Beverage company is planning to invest $106 million for the expansion and equipment upgrades on their distribution facility in ALEXANDRIA, LA. They are currently seeking approval for the project.

NEW YORK:

Global retail chain is planning for the construction of a 1.5 million sf distribution center in WALLKILL, NY. They are currently seeking approval for the project.

KENTUCKY:

Food products mfr. is planning for the construction of a 552,000 sf distribution center at 6630 Lewis Ln. in LOUISVILLE, KY. They are currently seeking approval for the project.

IOWA:

Agricultural processing company is planning to invest $56 million for the renovation and equipment upgrades on their processing facility in CLINTON, IA. They are currently seeking approval for the project.

NORTH CAROLINA:

Food and beverage mfr. is planning to invest $37 million for the expansion and equipment upgrades on their processing facility at 1040 Cedar Crest Dr. in BURLINGTON, NC. They are currently seeking approval for the project.

GEORGIA:

Pet food mfr. is planning to invest $32 million for a 301,000 sf expansion and equipment upgrades on their distribution center at 4955 Oakley Industrial Blvd. in FAIRBURN, GA. They are currently seeking approval for the project. Construction is expected to start in late Fall 2026, with completion slated for Fall 2027.

PENNSYLVANIA:

Pet food mfr. is planning for the renovation and equipment upgrades on a 216,000 sf distribution and cold storage facility at 757 Hellertown Rd. in BETHLEHEM, PA. Completion is slated for late 2026.

TENNESSEE:

Food products mfr. is planning to invest $24 million for the expansion and equipment upgrades on their processing and warehouse facility in MT. JULIET, TN. They are currently seeking approval for the project.

NEW YORK:

Food products distributor is planning to invest $18 million for the renovation and equipment upgrades on their warehouse facility in GLOVERSVILLE, NY. They are currently seeking approval for the project.

About Industrial SalesLeads, Inc.

Since 1959, Industrial SalesLeads, based in Jacksonville, FL is a leader in delivering industrial capital project intelligence and prospecting services for sales and marketing teams to ensure a predictable and scalable pipeline. Our Industrial Market Intelligence, IMI identifies timely insights on companies planning significant capital investments such as new construction, expansion, relocation, equipment modernization and plant closings in industrial facilities. The Outsourced Prospecting Services, an extension to your sales team, is designed to drive growth with qualified meetings and appointments for your internal sales team. Visit us at https://salesleadsinc.com/.

Each month, our team provides hundreds of industrial reports within a variety of industries.

NEWS SOURCE: Industrial SalesLeads Inc


This press release was issued on behalf of the news source (Industrial SalesLeads Inc), who is solely responsible for its accuracy, by Send2Press Newswire. Image, if any, was provided by the news source and not this website or the wire service. Information is believed accurate, as provided by the news source, but is not guaranteed.

To view the original story, visit: https://www.send2press.com/wire/food-and-beverage-sector-surges-to-second-highest-month-of-2026-with-63-new-planned-projects-in-august/

Copr. © 2026 Send2Press® Newswire, Calif., USA. -- REF: S2P STORY ID: S2P138126 NOREL-3B
 

Down Payment Resource identifies 2,746 homeownership programs nationwide in Q2 2026

Program count rises to a new high, with notable growth in grants, multi-unit and manufactured housing options as affordability pressures persist

ATLANTA, Ga., July 22, 2026 (SEND2PRESS NEWSWIRE) — Down Payment Resource (DPR), the housing industry’s leading technology for connecting homebuyers with homeownership programs, today released its Q2 2026 Homeownership Program Index (HPI) report, identifying 2,746 programs nationwide. The total represents an increase of 67 programs from Q1 2026, reflecting continued expansion of resources designed to improve affordability and access to homeownership, and is a new survey high.

Down Payment Resource
Image caption: Down Payment Resource (DPR).

Homeownership programs like down payment assistance (DPA) provide meaningful financial support that strengthens borrower profiles. By reducing loan-to-value ratios and covering upfront costs such as down payments, closing costs and rate buydowns, these programs help convert qualified demand into successful homeownership outcomes.

One standout finding this quarter is the growing number of grant programs, which require no repayment. Grant programs rose 6% from Q1 to Q2, with 234 programs representing 9% of all program types.

The Q2 findings also reveal a broad span in the type of assistance available. Of the 2,746 programs identified, 80% support new construction and 93% support existing construction, meaning builders and their lending partners have a wide range of programs to offer buyers regardless of whether they are purchasing a newly built home or an existing one.

Additionally, with 62% of programs allowing income limits above $100,000, and 291 programs carrying no income restrictions at all, down payment programs are not “niche resources” for a narrow audience. They are mainstream financial tools that the housing industry has historically undersold and an opportunity for homebuilders, lenders and real estate professionals to differentiate themselves by presenting every qualified buyer with options.

“Quarter after quarter, the universe of available programs keeps expanding, and so does the flexibility they offer,” said Rob Chrane, founder and CEO of Down Payment Resource. “The surge in grant programs is a good example. These aren’t resources for a narrow slice of buyers. They’re mainstream financial strategies that lenders and real estate professionals should be putting in front of every qualified borrower.”

KEY HPI REPORT FINDINGS

An examination of the 2,746 homeownership programs on July 1, 2026, resulted in the following key findings:

  • Count reaches new high: The total number of programs increased to 2,746, up from 2,679 in Q1 2026. Active and funded programs total 2,114 (77%), providing immediate opportunities for homebuyers across the country.
  • Grants surge: Grant programs increased 6% during Q2 to 234 programs. Grants now represent 9% of all program types, offering significant value for buyers seeking assistance that does not add to their debt burden.
  • More support for new and existing construction: 2,209 (80%) of programs support new construction, 2,544 (93%) support existing construction and 2,209 (80%) support both, giving homebuilders and lenders broad coverage regardless of what a buyer is purchasing.
  • Multi-unit programs expand: Programs supporting multi-unit properties (2–4 units) increased to 962, up 3% from Q1. Multi-unit eligibility expands access for buyers seeking rental income potential alongside homeownership, which is a growing consideration in today’s affordability environment.
  • Support for manufactured housing grows: Programs supporting manufactured homes increased to 1,089, representing 40% of all programs, a gain of 3% from Q1. Manufactured housing continues to be one of the most accessible lower-cost homeownership pathways, and expanded program support broadens options for buyers in markets where site-built homes remain out of reach.
  • Second mortgages remain dominant: Second-mortgage programs make up 56% of all program types, offering flexible structures such as deferred or forgivable loans that reduce upfront costs for buyers. Combined assistance programs account for 10% of programs and first-mortgage programs represent 9%.
  • More programs with no income limits: 291 programs (11%) carry no income restrictions, 2% higher than the previous quarter. These programs give lenders greater flexibility to qualify a broader range of borrowers including higher-income households.
  • Support for first-time and first-generation buyers expands: 1,696 programs (62%) are available to first-time homebuyers, a 2% increase from Q1. 35 programs support first-generation buyers, up 6% from Q1, continuing to expand access for those entering the market without family homeownership history.
  • Local providers lead program availability: Municipalities account for the largest share of programs at 39% (1,068), followed by nonprofits at 22% (601) and state housing finance agencies at 18% (485). Local HFAs represent an additional 8% (207 programs). Tribal organizations grew to 56 programs, up 4% from the previous quarter, reflecting expanding community-based program delivery.

A more detailed analysis of the Q2 2026 HPI findings, including infographics and examples of the programs described in this release, can be found on DPR’s website at: https://downpaymentresource.com/professional-resource/down-payment-assistance-continues-to-expand-in-q2-2026-reaching-2746-programs-nationwide/

For a complete list of homebuyer assistance programs by state, visit (PDF): https://downpaymentresource.com/wp-content/uploads/2026/07/HPI-state-by-state-data.Q22026.pdf

Members of the media are encouraged to contact DPR for data specific to their reporting needs.

METHODOLOGY:

Published quarterly, DPR’s HPI surveys the funding status, eligibility rules and benefits of U.S. homeownership programs administered by state and local housing finance agencies, municipalities, nonprofits and other housing organizations. DPR communicates with over 1,400 program providers throughout the year to track and update the country’s wide range of homeownership programs, including down payment and closing cost programs, Mortgage Credit Certificates (MCCs) and affordable first mortgages, in the DOWN PAYMENT RESOURCE® database.

ABOUT DOWN PAYMENT RESOURCE:

Down Payment Resource (DPR) is the mortgage industry’s affordability intelligence platform, operationalizing down payment assistance (DPA) at scale for lenders, MLSs and API users. Its embedded intelligence helps automate DPA eligibility, decisioning and delivery, connecting homebuyers with the assistance they need through a national database of over 2,700 programs. DPR’s technology is used by seven of the top 25 mortgage lenders, two of the largest real estate listing websites and 600,000 real estate agents. For more information, visit https://www.downpaymentresource.com/.

X: @DwnPmtResource #downpaymentassistance #downpayment

LOGO link for media: https://www.Send2Press.com/300dpi/26-0722-s2p-dpresc-300dpi.webp

NEWS SOURCE: Down Payment Resource


This press release was issued on behalf of the news source (Down Payment Resource), who is solely responsible for its accuracy, by Send2Press Newswire. Image, if any, was provided by the news source and not this website or the wire service. Information is believed accurate, as provided by the news source, but is not guaranteed.

To view the original story, visit: https://www.send2press.com/wire/down-payment-resource-identifies-2746-homeownership-programs-nationwide-in-q2-2026/

Copr. © 2026 Send2Press® Newswire, Calif., USA. -- REF: S2P STORY ID: S2P136959 NOREL-3B

 

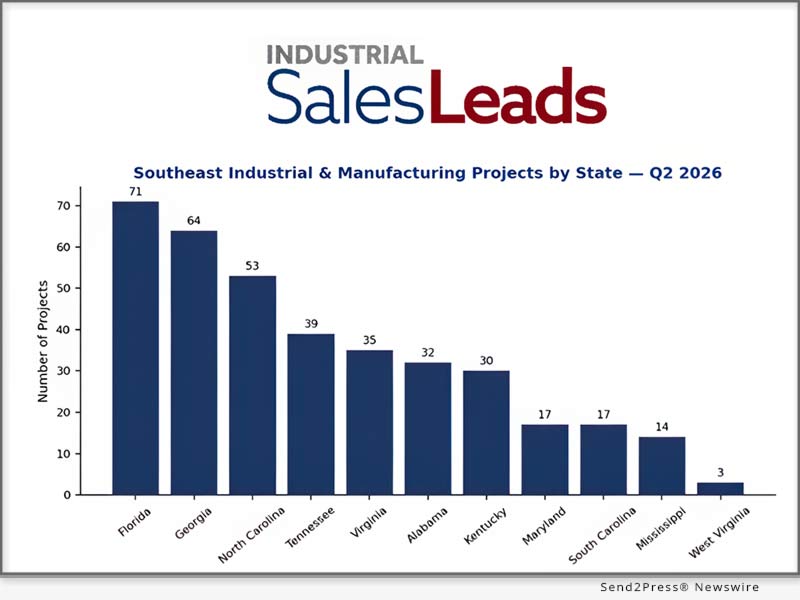
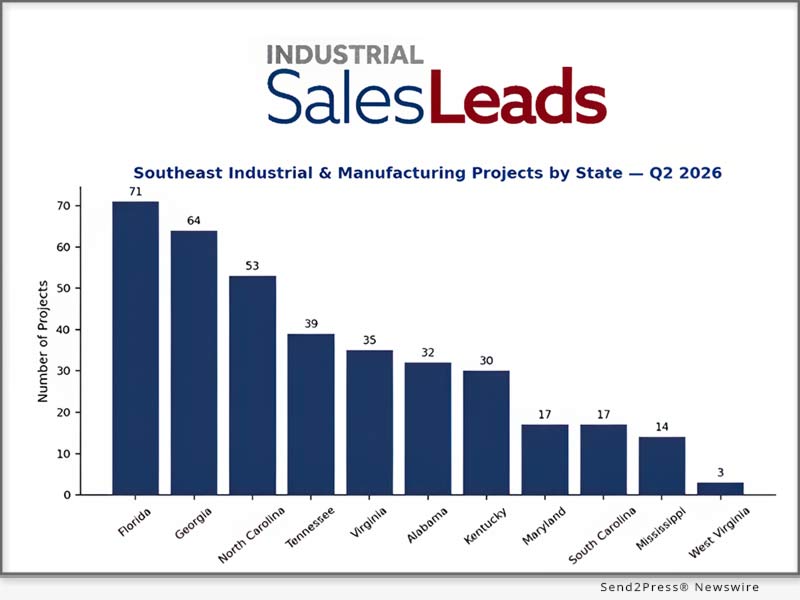
New Industrial, Manufacturing and Supply Chain Facility Projects Signal Sustained Capital Investment Across the Southeast in Q2 2026

JACKSONVILLE BEACH, Fla., July 21, 2026 (SEND2PRESS NEWSWIRE) — Capital investment across the Southeast United States held strong through the second quarter of 2026, with new construction, facility expansion, equipment modernization, and plant renovation activity spanning automotive, food and beverage, aerospace, data centers, chemicals, pharmaceutical, and life sciences, and distribution and warehousing. Our research team at Industrial SalesLeads, Inc. tracked 375 new industrial, manufacturing, and supply chain facility projects across 11-states in the Southeast.

New Industrial, Manufacturing and Supply Chain Facility Projects Signal Sustained Capital Investment Across the Southeast in Q2 2026
Image caption: New Industrial, Manufacturing and Supply Chain Facility Projects Signal Sustained Capital Investment Across the Southeast in Q2 2026.

States include: Alabama, Florida, Georgia, Kentucky, Maryland, Mississippi, North Carolina, South Carolina, Tennessee, Virginia, and West Virginia. The collective states continue to show momentum in site selection, plant expansion, and economic development activity.

More than $23.7 billion in capital investment was confirmed across 137 projects tracked this quarter, including 28 projects valued at over $100 million each. Leading the way is a $5 billion aerospace manufacturing facility in North Carolina and a $4 billion automotive plant expansion in Alabama.

The following are selected highlights on new industrial and manufacturing construction news across the Southeast region:

SOUTHEAST MANUFACTURING — BY PROJECT CATEGORY

Manufacturing/Production – 189 (50%)

Construction – 32 (9%)

Distribution – 30 (8%)

Transportation, Utilities & Data Centers – 30 (8%)

SOUTHEAST MANUFACTURING ACTIVITY – BY SUBSECTORS

Transportation Equipment – 38

Food & Beverage – 25

Chemicals – 20

Electronic & Electrical Equipment – 18

Fabricated Metal – 16

Industrial Machinery & Equipment – 10

Automotive and aerospace manufacturers led the Southeast manufacturing subsectors this quarter, strengthening the region’s rise as a hub for transportation-equipment capital investment, followed by food and beverage processing and chemical manufacturing.

SOUTHEAST MANUFACTURING — BY PROJECT LOCATION

Florida – 71

Georgia – 64

North Carolina – 53

Tennessee – 39

Virginia – 35

Alabama – 32

Kentucky – 30

Maryland – 17

South Carolina – 17

Mississippi – 14

West Virginia – 3

Florida, Georgia and North Carolina accounted for nearly half of all new Southeast industrial and manufacturing project activity tracked this quarter.

SOUTHEAST MANUFACTURING — BY PROJECT SCOPE/ACTIVITY

Renovation – 149

New Construction – 136

Equipment Upgrade – 136

Expansion – 67

Relocation – 61

SOUTHEAST MANUFACTURING EQUIPMENT CATEGORIES IN DEMAND

Across all 375 tracked Southeast industrial and manufacturing projects this quarter, project managers are procuring the following equipment:

  • 88%: Lighting, HVAC Equipment
  • 85%: Compressed Air Systems
  • 83%: Mechanical Construction, Networking/Security Equipment
  • 74%: Fire Protection Equipment
  • 61%: Material Handling/Storage Equipment
  • 56%: Lift Trucks
  • 53%: Loading Dock Equipment
  • 51%: Conveyors
  • 47%: Floor Coatings
  • 45%: Cranes and Hoists

— TOP TRACKED INDUSTRIAL & MANUFACTURING PROJECTS IN THE SOUTHEAST —

NORTH CAROLINA:

Aerospace company is planning to invest $5 billion in the construction of an 8 million sf manufacturing facility in North Carolina. This is the single largest capital investment tracked in the Southeast this quarter. A data center company is seeking approval for a large-scale data center campus with construction expected to start Fall 2026.

ALABAMA:

A car manufacturer is planning to invest $4 billion in the expansion of its automotive manufacturing facility in AL. An electronic component manufacturer, is planning a $500 million manufacturing and research facility.

VIRGINIA:

Data center developer is planning to invest $3 billion in the construction of a data center campus in VA. Battery component manufacturer has started construction on a $1.3 billion, 1 million sf facility.

FLORIDA:

A medical device manufacturer, is investing $1 billion in the construction of a distribution facility with construction underway.

SOUTH CAROLINA:

A refined metals company is planning to invest $1 billion in the renovation and equipment upgrade of an 800,000 sf manufacturing. Candy manufacturer is planning a $675 million processing and warehouse campus.

Largest Planned Project

The largest project tracked in the Southeast region this quarter is owned by JetZero, an aerospace manufacturer planning to invest $5 billion in the construction of an 8 million sf manufacturing facility in North Carolina.

About Industrial SalesLeads, Inc.

Since 1959, Industrial SalesLeads, based in Jacksonville, FL is a leader in delivering industrial capital project intelligence and prospecting services for sales and marketing teams to ensure a predictable and scalable pipeline. Our Industrial Market Intelligence, IMI identifies timely insights on companies planning significant capital investments such as new construction, expansion, relocation, equipment modernization and plant closings in industrial facilities. The Outsourced Prospecting Services, an extension to your sales team, is designed to drive growth with qualified meetings and appointments for your internal sales team. Visit us at https://salesleadsinc.com/.

Each month, our team provides hundreds of industrial reports within a variety of industries.

NEWS SOURCE: Industrial SalesLeads Inc


This press release was issued on behalf of the news source (Industrial SalesLeads Inc), who is solely responsible for its accuracy, by Send2Press Newswire. Image, if any, was provided by the news source and not this website or the wire service. Information is believed accurate, as provided by the news source, but is not guaranteed.

To view the original story, visit: https://www.send2press.com/wire/new-industrial-manufacturing-and-supply-chain-facility-projects-signal-sustained-capital-investment-across-the-southeast-in-q2-2026/

Copr. © 2026 Send2Press® Newswire, Calif., USA. -- REF: S2P STORY ID: S2P136928 NOREL-3B
 

Volume growth from existing staff ranks as lenders’ top priority for the second half of 2026, The Mortgage Collaborative’s survey finds

Lenders also focused on early-stage AI adoption and reducing cost-per-loan

SAN DIEGO, Calif., July 20, 2026 (SEND2PRESS NEWSWIRE) — The Mortgage Collaborative (TMC), the nation’s largest independent cooperative network for mortgage lenders, today released results from its June 2026 Pulse of the Network survey. The biannual survey gathered input from mortgage lenders, including independent mortgage banks, credit unions and depository institutions, on strategic priorities heading into the second half of 2026.

The Mortgage Collaborative - TMC
Image caption: The Mortgage Collaborative.

According to the survey results, lenders are focused on growth heading into the second half of 2026 and intend to rely mostly on existing staff to achieve that goal. Three-quarters of respondents said their primary growth strategy is to increase production from their current sales team, while 64% plan to recruit experienced loan officers. Overall, 83% said their companies are focused on growth, and 89% expect origination volume to climb in the second half of the year. Most are projecting moderate gains of 5% to 20%, though 17% anticipate a significant jump. Elevated interest rates, tight housing inventory and margin compression remain the biggest obstacles.

Technology ranked second on lenders’ priority lists, though most are still in the exploration phase with AI. While 83% said they are evaluating AI tools across their businesses, only 17% have deployed the technology in live production workflows. The most frequently cited barrier to AI adoption is trust, with a quarter of respondents saying their organizations aren’t yet confident in AI-generated outputs.

Operational efficiency rounded out lenders’ top three priorities, with an emphasis on making better use of existing investments and talent. Reducing loan production costs was the top operational priority for 86% of respondents, followed by vendor and technology consolidation at 64% and reduction in turn times at 56%. Personnel-wise, three-quarters of respondents say they are investing in technology to improve loan officer productivity, and 72% plan to improve compensation and incentive structures to keep top performers.

Borrower retention/recapture ranked as the top secondary market priority by 75% of respondents, in light of the growing opportunity in this area due to gradually declining interest rates. Nearly as many, 72%, are working to broaden their investor and agency relationships, while 69% are strengthening their post-close processes. From a product perspective, respondents identified conventional purchase loans and non-QM lending as the two largest opportunities for volume growth in the second half of the year.

Lenders’ caution around AI also extends to their compliance departments, where automated decisioning now consumes more resources than any other area of compliance, according to 75% of respondents. Nearly half expressed concerns about fair lending risk tied to AI decisioning, and 22% say they haven’t yet fully assessed it. State-level regulatory complexity remains a burden as well, with 53% calling it a meaningful drain on resources.

“The results show a membership that is more confident about volume in the second half of the year, but still disciplined about how they get there,” said Jodi Hall, president and CEO of The Mortgage Collaborative. “Members are prioritizing production from their current teams and technology investment over expansion, and they are asking specific questions about AI governance and per-loan costs.”

TMC conducts the Pulse of the Network survey twice a year to identify what lender members are navigating and where they are seeking support. Results inform programming for TMC’s working groups, lender-only collaboration labs, TMC Insight benchmarking initiatives and conference programming. The survey results are provided at https://mailchi.mp/mtgcoop/pulse-of-the-network.

About The Mortgage Collaborative

The Mortgage Collaborative (TMC) is a membership-driven organization that empowers mortgage lenders across the United States through networking, education and advocacy. TMC fosters an environment of collaboration and innovation, ensuring its members succeed regardless of market conditions. For more information, visit mortgagecollaborative.com.

LOGO link for media: https://mortgagecollaborative.com/wp-content/uploads/2025/12/Color-Logo-The-Mortgage-Collaborative-scaled-1.png

NEWS SOURCE: The Mortgage Collaborative


This press release was issued on behalf of the news source (The Mortgage Collaborative), who is solely responsible for its accuracy, by Send2Press Newswire. Image, if any, was provided by the news source and not this website or the wire service. Information is believed accurate, as provided by the news source, but is not guaranteed.

To view the original story, visit: https://www.send2press.com/wire/volume-growth-from-existing-staff-ranks-as-lenders-top-priority-for-the-second-half-of-2026-the-mortgage-collaboratives-survey-finds/

Copr. © 2026 Send2Press® Newswire, Calif., USA. -- REF: S2P STORY ID: S2P136920 NOREL-3B
 

New Food and Beverage Industry Planned Projects Rebounds in June 2026 Up 15-percent with 59 New Projects

During the month of June, our research team identified 2 new Food and Beverage facility construction projects with an estimated value of $100 million or more

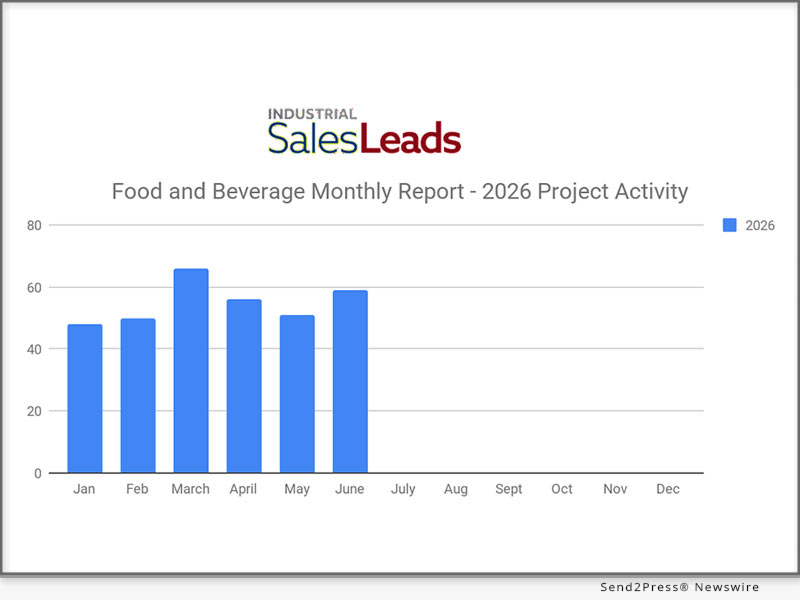
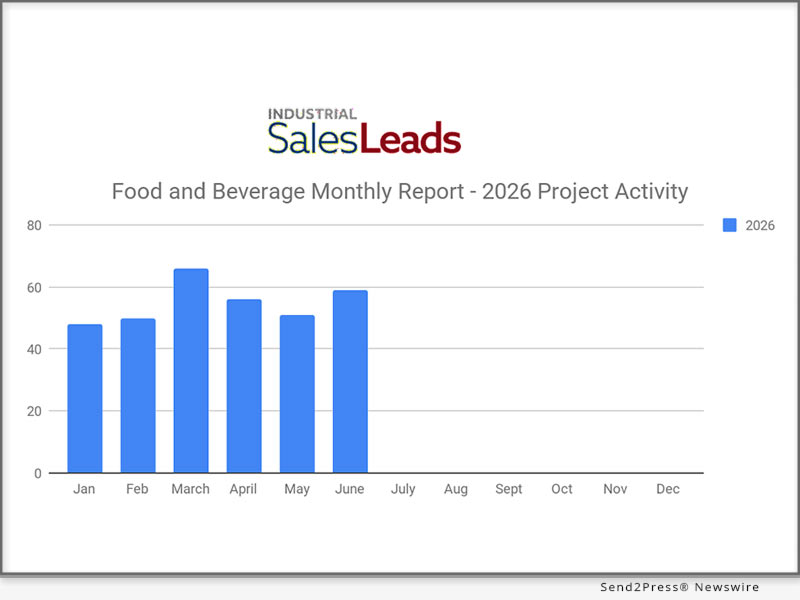
JACKSONVILLE, Fla., July 14, 2026 (SEND2PRESS NEWSWIRE) — Industrial SalesLeads today announced the June 2026 results of its planned capital project spending report for the Food and Beverage industry. New planned projects rebounded during the month, with research confirming 59 new Food and Beverage projects in June 2026, a 15.7% increase from the 51 projects identified in May 2026. The firm tracks North American planned industrial capital project activity, including facility expansions, new plant construction, and significant equipment modernization projects.

New Food and Beverage Industry Planned Projects Rebounds in June 2026 Up 15% with 59 New Projects
Image caption: New Food and Beverage Industry Planned Projects Rebounds in June 2026 Up 15% with 59 New Projects.

The following are selected highlights on new Food and Beverage industry construction news.

Food and Beverage Project Type

  • Processing Facilities – 40 New Projects
  • Distribution and Industrial Warehouse – 23 New Projects

Food and Beverage Project Scope/Activity

  • New Construction – 15 New Projects
  • Expansion – 12 New Projects
  • Renovations/Equipment Upgrades – 32 New Projects
  • Plant Closing – 9 New Projects

Food and Beverage Project Location (Top 10 States)

  • Ohio – 5
  • California – 4
  • Kentucky – 4
  • New York – 4
  • Pennsylvania – 4
  • Washington – 4
  • Iowa – 3
  • Illinois – 3
  • Virginia – 3
  • Wisconsin – 3

Food and Beverage Equipment Categories in Demand

In the month of June, identified Food and Beverage project managers are procuring the following equipment:

87%: Material Handling/Storage Equipment, Lift Trucks

85%: Compressed Air Systems

84%: Lighting, HVAC Equipment

82%: Conveyors, Cranes and Hoists

80%: Loading Dock Equipment, Mechanical Construction, Fire Protection Equipment, Networking/Security Equipment

61%: Control Systems and Instrumentation

56%: Air Emissions Control Equipment, Packaging Equipment, Process Equipment, Heat Exchangers

53%: Tanks/Vessels, Stainless

43%: Floor Coatings

Largest Planned Project

During the month of June, our research team identified 2 new Food and Beverage facility construction projects with an estimated value of $100 million or more.

The largest project is owned by H-E-B, who is investing $200 million and has recently started the expansion and equipment upgrades on their processing facility in ARABI, LA. Completion is slated for 2028.

Top 10 Tracked Food and Beverage Projects

VIRGINIA:

Skincare and nutritional supplement mfr. is planning to invest $85 million for the renovation and equipment upgrades on a 146,000 sf processing, warehouse, laboratory, and office facility at 2797 Frontage Rd. NW in ROANOKE, VA. They have recently received approval for the project.

GEORGIA:

Poultry processing company is planning to invest $75 million for the expansion and equipment upgrades on their processing facility in ELLIJAY, GA. They are currently seeking approval for the project.

INDIANA:

Grain marketing and transportation service provider is planning to invest $47 million for the expansion of their warehouse and storage facility in MOUNT VERNON, IN. They have recently received approval for the project.

DISTRICT OF COLUMBIA:

Non-profit organization is planning to invest $30 million for a 17,000 sf expansion, renovation, and equipment upgrades on their processing facility in WASHINGTON, DC. They have recently received approval for the project. Completion is slated for early 2028.

NEW YORK:

Food service distributor is planning for the renovation and equipment upgrades on a recently acquired 333,400 sf distribution center at 1 Van Bergen St. in WEST COXSACKIE, NY. They are currently seeking approval for the project.

KENTUCKY:

Tobacco products mfr. is planning for the construction of a 270,000 sf processing facility in HOPKINSVILLE, KY. They are also planning to close their processing facility in NASHVILLE, TN and will relocate operations to the HOPKINSVILLE, KY facility upon completion in 2028.

OHIO:

Brewery is planning to invest $18 million for the expansion of their warehouse and office space in TRENTON, OH. They are currently seeking approval for the project.

IOWA:

Food product transportation company is planning to invest $14 million for the construction of a 40,000 sf warehouse in CEDAR RAPIDS, IA. They are currently seeking approval for the project. Completion is slated for late 2028.

MASSACHUSETTS:

Specialty supplement mfr. is planning to invest $12 million for the renovation and equipment upgrades on a 93,000 sf processing facility at 5-7 Industrial Rd. in MILFORD, MA. They are currently seeking approval for the project and will relocate their operations upon completion.

KENTUCKY:

Grocery distributor is planning to invest $10 million for the expansion and equipment upgrades on their warehouse and office facility in LOUISVILLE, KY. They are currently seeking approval for the project.

About Industrial SalesLeads, Inc.

Since 1959, Industrial SalesLeads, based in Jacksonville, FL is a leader in delivering industrial capital project intelligence and prospecting services for sales and marketing teams to ensure a predictable and scalable pipeline. Our Industrial Market Intelligence, IMI identifies timely insights on companies planning significant capital investments such as new construction, expansion, relocation, equipment modernization and plant closings in industrial facilities. The Outsourced Prospecting Services, an extension to your sales team, is designed to drive growth with qualified meetings and appointments for your internal sales team. Visit us at https://salesleadsinc.com/.

Each month, our team provides hundreds of industrial reports within a variety of industries.

Learn more:

https://www.salesleadsinc.com/industry/food-and-beverage/

https://www.salesleadsinc.com/blog/

NEWS SOURCE: Industrial SalesLeads Inc


This press release was issued on behalf of the news source (Industrial SalesLeads Inc), who is solely responsible for its accuracy, by Send2Press Newswire. Image, if any, was provided by the news source and not this website or the wire service. Information is believed accurate, as provided by the news source, but is not guaranteed.

To view the original story, visit: https://www.send2press.com/wire/new-food-and-beverage-industry-planned-projects-rebounds-in-june-2026-up-15-percent-with-59-new-projects/

Copr. © 2026 Send2Press® Newswire, Calif., USA. -- REF: S2P STORY ID: S2P136765 NOREL-3B
 

HotDeals Releases 2026 Mid-Year Savings Report Highlighting Accelerating Coupon Activity Across Global Markets

Internal platform data shows savings activity outpaced coupon inventory growth during the first half of 2026, with strong momentum across the U.S. and international markets

SAN FRANCISCO, Calif., July 13, 2026 (SEND2PRESS NEWSWIRE) — HotDeals today released its 2026 Mid-Year Savings Report, highlighting coupon activity and savings trends observed across its global platform during the first half of the year. Based on HotDeals’ internal platform data collected between approximately January and mid-July 2026, the report shows continued growth in coupon availability, merchant coverage, and savings activity, with demand for verified discounts increasing faster than the overall supply of coupon codes.

HotDeals
Image caption: HotDeals logo.

In the United States, the number of merchants available on the HotDeals platform increased from 14,704 to 15,308 (+4.1%), while the platform’s coupon inventory expanded from 203,000 to 231,804 active coupon codes (+14.2%). During the same period, savings records generated across the U.S. platform increased from 2.69 million to 7.84 million, representing 191.8% growth.

The report also found that coupon availability on the consumer-facing website expanded significantly. Publicly displayed coupon codes increased from 33,667 to 50,418 (+49.8%), while front-end savings records grew from 125,186 to 212,144 (+69.5%).

One of the report’s key findings is that savings activity grew substantially faster than coupon inventory. While the number of available U.S. coupon codes increased by 14.2%, savings records increased by 191.8%, indicating that existing coupon offers were used more frequently across the platform during the first half of the year.

“Our mid-year data suggests consumers are becoming more intentional about seeking savings before making online purchases,” said a HotDeals spokesperson. “As coupon availability continues to improve, shoppers appear to be making greater use of verified discounts across a wider range of retailers.”

The report also highlights strong momentum across HotDeals’ international markets. During the first half of 2026, savings records increased by 1,133% in the United Kingdom, 211% in Germany, 208% in France, and 180% in Australia. Emerging markets also showed continued expansion, with merchant and coupon inventories growing in South Korea, while savings activity more than doubled in Japan and nearly quadrupled in Hong Kong.

In addition, HotDeals observed sustained engagement with its coupon verification feature. Verification activity remained consistently active in the United States throughout the reporting period, with Germany and France also recording strong levels of verification usage, reflecting continued consumer interest in confirming coupon validity before checkout.

The report found that merchant coverage on the U.S. consumer-facing platform remained above 98%, with 15,213 of 15,308 merchants displaying at least one available coupon or promotional offer. This broad coverage helps shoppers access verified savings opportunities across a diverse range of online retailers.

The findings indicate that retailers and consumers alike are entering the second half of 2026 with discount verification as a baseline expectation rather than an occasional benefit — a shift that may reshape how promotional strategies are designed for the upcoming holiday season.

About HotDeals

HotDeals (https://www.hotdeals.com/) is a verified coupon platform where real users test promo codes before they are published. The HotDeals Research Team analyzes consumer savings trends across major shopping events and publishes periodic insights through the HotDeals Consumer Savings Index.

Learn more: https://www.hotdeals.com/

NEWS SOURCE: HotDeals


This press release was issued on behalf of the news source (HotDeals), who is solely responsible for its accuracy, by Send2Press Newswire. Image, if any, was provided by the news source and not this website or the wire service. Information is believed accurate, as provided by the news source, but is not guaranteed.

To view the original story, visit: https://www.send2press.com/wire/hotdeals-releases-2026-mid-year-savings-report-highlighting-accelerating-coupon-activity-across-global-markets/

Copr. © 2026 Send2Press® Newswire, Calif., USA. -- REF: S2P STORY ID: S2P136756 NOREL-3B
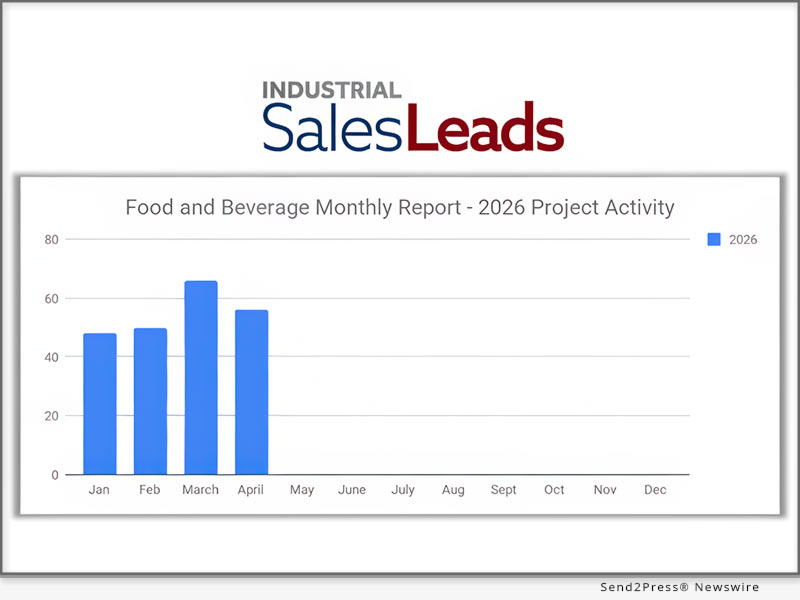
 

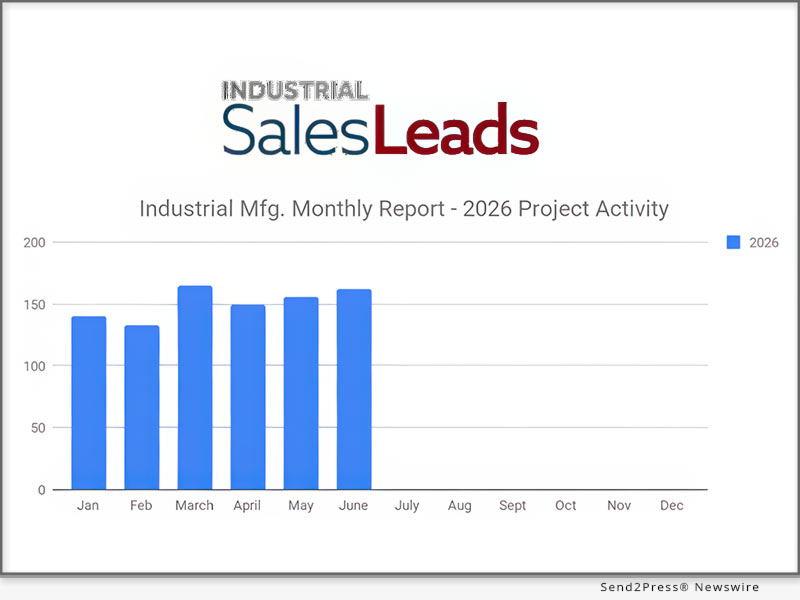
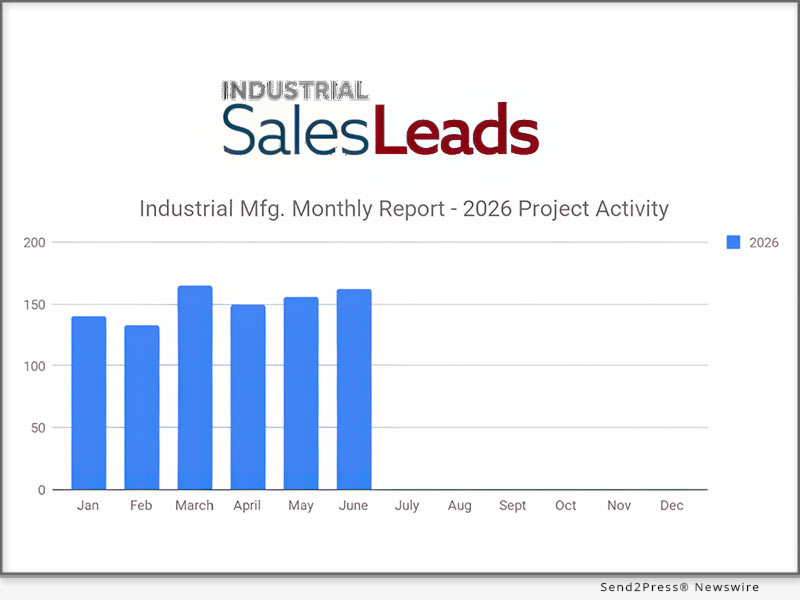
Industrial Manufacturing Sector Posts 8.72% Q2 Growth as June Planned Projects Reach 162

JACKSONVILLE, Fla., July 7, 2026 (SEND2PRESS NEWSWIRE) — Industrial SalesLeads’ June 2026 report on planned capital project spending shows continued momentum in the Industrial Manufacturing sector, with 162 new projects tracked with Q2 quarter growth of 8.72%. The Firm’s research, which spans North American facility expansions, new plant construction, and major equipment modernization efforts, identified 20 projects valued at $100 million or more, led by a $5 billion manufacturing and warehouse campus planned by Convalt Energy, Inc. in Gallup, NM.

Industrial Manufacturing Sector Posts 8.72% Q2 Growth as June Planned Projects Reach 162
Image caption: Industrial Manufacturing Sector Posts 8.72% Q2 Growth as June Planned Projects Reach 162.

The following are selected highlights on new Industrial Manufacturing industry construction news.

Industrial Manufacturing – By Project Type

  • Manufacturing/Production Facilities – 147 New Projects
  • Distribution and Industrial Warehouse – 65 New Projects

Industrial Manufacturing – By Project Scope/Activity

  • New Construction – 49 New Projects
  • Expansion – 51 New Projects
  • Renovations/Equipment Upgrades – 91 New Projects
  • Plant Closings – 11 New Projects

Industrial Manufacturing – By Project Location (Top 10 States)

  • Texas – 11
  • Indiana – 10
  • Michigan – 9
  • Wisconsin- 9
  • New York – 8
  • Ohio – 8
  • Tennessee – 8
  • Virginia – 8
  • California – 7
  • Alabama – 6
  • Iowa – 6

INDUSTRIAL EQUIPMENT CATEGORIES IN DEMAND

In the month of June, identified industrial manufacturing project managers are procuring the following equipment:

92%: Compressed Air Systems

89%: Material Handling/Storage Equipment, Lift Trucks, Lighting, HVAC Equipment

80% to 83%: Mechanical Construction, Networking/Security Equipment, Conveyors, Cranes and Hoists

78%: Loading Dock Equipment, Fire Protection Equipment

72%: Air Emissions Control Equipment

66%: Control Systems and Instrumentation, Packaging Equipment, Manufacturing Equipment, Heat Exchangers

47%: Floor Coatings

LARGEST PLANNED PROJECT

During the month of June, our research team identified 20 new Industrial Manufacturing facility construction projects with an estimated value of $100 million or more.

The largest project is owned by Convalt Energy, Inc., who is planning to invest $5 billion for the construction of a manufacturing and warehouse campus in GALLUP, NM. They are currently seeking approval for the project. Construction will occur in multiple phases.

TOP 10 TRACKED INDUSTRIAL MANUFACTURING PROJECTS

PENNSYLVANIA:

Steel company is planning to invest $3 billion for the construction of a manufacturing facility in BRADDOCK, PA. Construction is expected to start in late 2026, with completion slated for 2029.

MASSACHUSETTS:

Metal parts mfr. is planning to invest $1.3 billion for the construction of a manufacturing facility in DEVENS, MA. They are currently seeking approval for the project.

KANSAS:

Aerospace company is planning to invest $1 billion for the expansion and equipment upgrades on their manufacturing facility in WICHITA, KS. They are currently seeking approval for the project.

MONTANA:

Aerospace component mfr. is planning to invest $800 million for the construction of a 2 million sf manufacturing facility in GREAT FALLS, MT. Construction is expected to start in Summer 2026, with completion of phase I slated for late 2027.

CALIFORNIA:

Startup recycled paper product mfr. is planning to invest $500 million for the construction of a manufacturing facility in MODESTO, CA. They are currently seeking approval for the project.

INDIANA:

Biotechnology company is planning to invest $150 million for the construction of a 130,000 sf processing facility in WHITESTOWN, IN. They are currently seeking approval for the project.

SOUTH CAROLINA:

Pharmaceutical company is planning to invest $119 million for the expansion and equipment upgrades on their processing facility in NORTH AUGUSTA, SC. They are currently seeking approval for the project. Completion is slated for late 2027.

TENNESSEE:

Towing and recovery equipment mfr. is planning to invest $100 million for the construction of a 200,000 sf manufacturing facility in OOLTEWAH, TN. Construction is expected to start in late Summer 2026.

DELAWARE:

Biotechnology company is planning to invest $100 million for the construction of a 138,000 sf laboratory, processing, and office facility in GLASGOW, DE. They are currently seeking approval for the project.

INDIANA:

Wire and cable mfr. is planning to invest $100 million for a 143,000 sf expansion and equipment upgrades on their manufacturing facility at 7950 Rockville Rd. in INDIANAPOLIS, IN. They are currently seeking approval for the project.

About Industrial SalesLeads, Inc.

Since 1959, Industrial SalesLeads, based in Jacksonville, FL is a leader in delivering industrial capital project intelligence and prospecting services for sales and marketing teams to ensure a predictable and scalable pipeline. Our Industrial Market Intelligence, IMI identifies timely insights on companies planning significant capital investments such as new construction, expansion, relocation, equipment modernization and plant closings in industrial facilities. The Outsourced Prospecting Services, an extension to your sales team, is designed to drive growth with qualified meetings and appointments for your internal sales team. Visit us at https://salesleadsinc.com/.

Each month, our team provides hundreds of industrial reports within a variety of industries.

Learn more:

https://www.salesleadsinc.com/data-solutions/industrial-project-reports/

https://www.salesleadsinc.com/blog/

NEWS SOURCE: Industrial SalesLeads Inc


This press release was issued on behalf of the news source (Industrial SalesLeads Inc), who is solely responsible for its accuracy, by Send2Press Newswire. Image, if any, was provided by the news source and not this website or the wire service. Information is believed accurate, as provided by the news source, but is not guaranteed.

To view the original story, visit: https://www.send2press.com/wire/industrial-manufacturing-sector-posts-8-72-q2-growth-as-june-planned-projects-reach-162/

Copr. © 2026 Send2Press® Newswire, Calif., USA. -- REF: S2P STORY ID: S2P136665 NOREL-3B
 

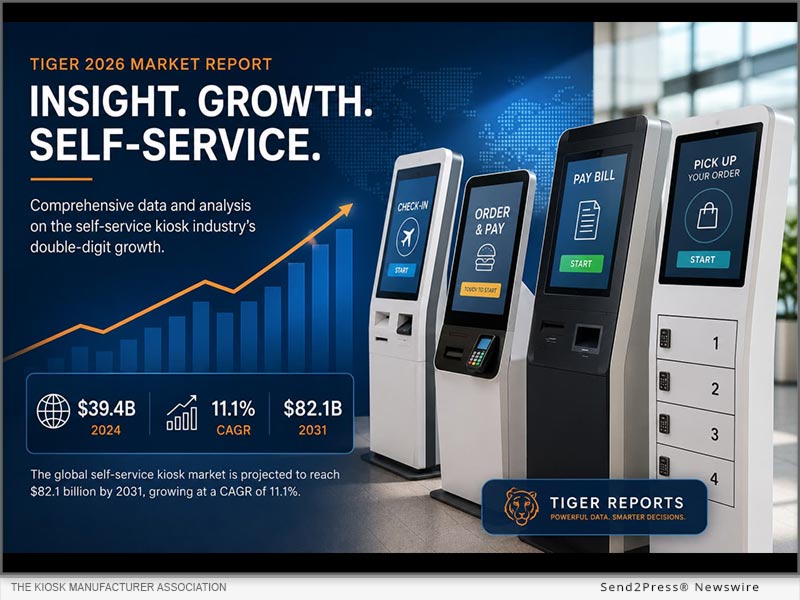
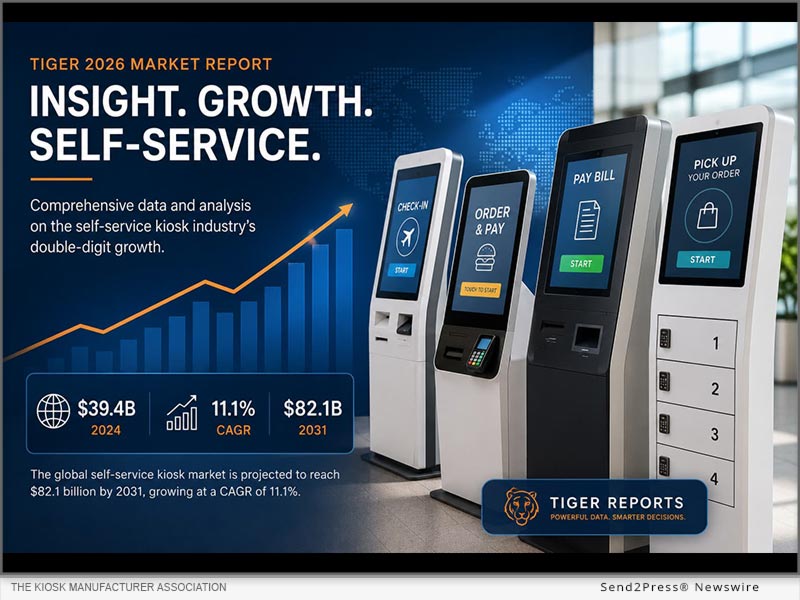
Report offers multi-faceted insight on self-service kiosk industry’s double-digit growth

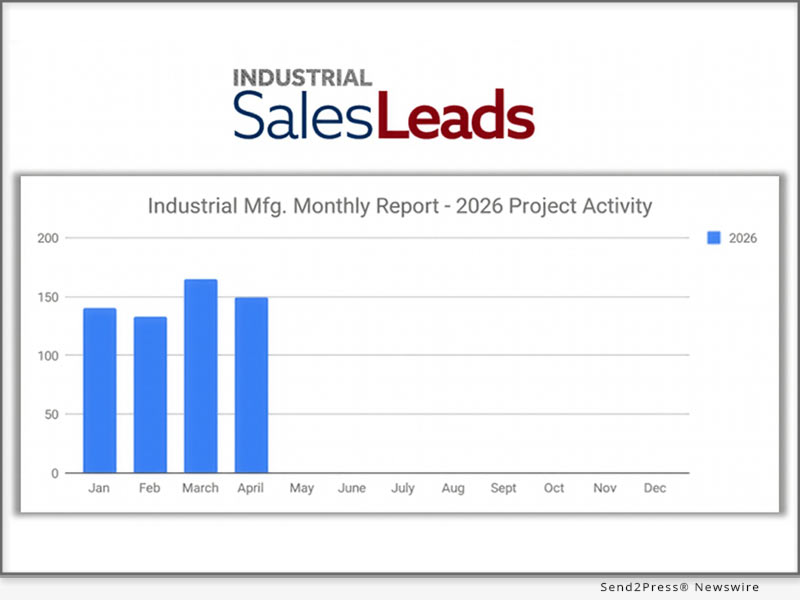
DENVER, Colo., July 6, 2026 (SENDPRESS NEWSWIRE) — The self-service kiosk industry continues to expand at a fast pace, driven by evolving automation technology and growing customer acceptance of self-service in nearly all venues. Companies and organizations seeking to understand this technology-intensive sector now have a comprehensive and easy-to-understand resource, the Tiger 2026 Market Report, courtesy of the Kiosk Manufacturer Association.

Report offers multi-faceted insight on self-service kiosk industry’s double-digit growth
Image caption: Report offers multi-faceted insight on self-service kiosk industry’s double-digit growth.

The 35-page report sizes the global self‑service kiosk market at about $39.4 billion in 2024, rising to roughly $82.1 billion by 2031, marking an 11.1 percent combined annual growth rate. The numbers are based on previous KMA reports, seven different industry reports, economic data, regulatory filings, reports from publicly traded companies and additional input from companies.

The report is designed to benefit kiosk industry companies in their business planning and those interested in investing in this fast growing trade.

“The weighted whole‑market growth rate comes out to 11.1 percent CAGR, but that ‘average’ hides enormous spread between segments,” said Craig Keefner, editor in chief of the report.

The report breaks the self-service kiosk industry into 14 segments which are modeled individually:

  • EV charging
  • Smart vending/micro markets
  • Smart lockers
  • Healthcare
  • Unattended POS
  • Self ordering for QSRs and fast casual restaurants
  • Digital signage
  • Check-in (hotel, airline, events)
  • Self checkout
  • Ticketing
  • Financial services/ATMs
  • Bill payment
  • Crypto ATMs
  • Others

The report also covers six adjacent verticals — parking, gaming, betting, DMV, self‑storage and self-service carwashes — contributing more than $7 billion on top of core kiosk spend.

The segment-built model for the report prevents double counting of segments in the final total.

SEGMENT HIGHLIGHTS

Segment highlights include:

  • EV charging kiosks come in at 31.5 percent CAGR, taking the category from about $0.85 billion to $5.8 billion by 2031.
  • Smart vending and micro‑markets grow at 16.5 percent CAGR, moving roughly from $1.5 billion to $4.5 billion.
  • Unattended POS and smart lockers grow in the mid‑teens, while self‑checkout grows around 9 percent but remains the single largest line item at about $15.4 billion.
  • At the other end of the growth curve, crypto ATMs are expanding at 4.2 percent, still cash‑flow positive, but no longer a significant growth story.

THREE CONVERGING FORCES CONTINUE TO ANCHOR THE SELF-SERVICE KIOSK INDUSTRY:

  • Faster EV-charging kiosk roll-out under the U.S. National Electric Vehicle Infrastructure (NEVI) government initiative and the European Union Alternative Fuels Infrastructure Regulation (AFIR) ruling.
  • The operational pull of the European Accessibility Act (in force since June 28, 2025).
  • The large language model (LLM) voice transition in quick-serve restaurant (QSR) drive-thru.
  • Each of these forces is now expressed in segment-specific growth rates rather than averaged into a single whole-market number.

GROWTH SCENARIOS

The report also offers Bull/Base/Bear growth scenarios through 2031 for each of the 14 segments, with identified drivers such as EV charging build‑out, accessibility mandates, services penetration and AI reliability.

One of the most unique benefits the report offers is a quantified understanding of the role service plays in kiosk revenue as opposed to hardware revenue. While hardware accounts for the lion’s share of industry revenue, service is growing faster than hardware, commanding $12.4 billion in 2026. In addition to boosting revenue, service supports kiosk uptime, reliability and AI readiness.

RETROFIT VERSUS RIP-AND-REPLACE

One of the most practical outputs of the Tiger Report is a normalized five‑year total cost of ownership (TCO) model that compares retrofit against rip‑and‑replace.

Retrofit cost comes in around $7,700 per kiosk over five years, versus roughly $18,000 for rip‑and‑replace, a 57 percent lower TCO. On a 1,000‑unit fleet, that gap implies about $10.3 million of preserved capital by upgrading instead of starting over.

GEOGRAPHIC ANALYSIS

The report also includes geographic analysis of industry revenue. The United States commands about 37 percent of the global market at roughly $14.5 billion, followed by China at 17 percent ($6.8 billion), rest of Asia and Pacific at 14 percent ($5.5 billion), and core Europe (UK/Germany/France) at 13 percent ($5.1 billion). The rest of Asia Pacific is compounding fastest from a smaller base, while European growth is accelerated by the EU Accessibility Act moving from regulation to procurement driver.

The report comes in PDF form with 22 chapters and three appendices covering segment sizing, methodology, services, accessibility and adjacent verticals.

PURCHASE OPTIONS

The report is available in three versions:

  • The Basic Report (35 pages): $495.00 (Launch discount 40 percent through July 31, 2026.)
  • The Analyst Bundle buyers report includes an Excel market data pack, an analyst workbook, future updates through December 2026, and a voice AI in self‑service brief. Price: $995.00 (Launch discount 40 percent through July 31, 2026.)
  • The Enterprise License report includes a license to view TIG content, a one‑hour live analyst briefing, and a one‑year TIG Silver Sponsorship with weekly intelligence emails, with a launch price of $3,999.00 versus a stated package value of $8,200.00 through July 31, 2026.

To purchase these reports, click herehttps://keefner3.gumroad.com/

ABOUT THE KIOSK MANUFACTURER ASSOCIATION:

The Kiosk Manufacturer Association, based in Denver, Colorado, is an association focused on documenting, educating and improving self-service for customers and employees through kiosks and information technology. https://kioskindustry.org/

MEDIA ONLY CONTACT
Craig Keefner
The Industry Group
craig@industrygroup.org
720-324-1837

MULTIMEDIA

Image link for media: https://www.Send2Press.com/300dpi/26-0706-s2p-kmatiger-300dpi.webp

NEWS SOURCE: Kiosk Manufacturer Association


This press release was issued on behalf of the news source (Kiosk Manufacturer Association), who is solely responsible for its accuracy, by Send2Press Newswire. Image, if any, was provided by the news source and not this website or the wire service. Information is believed accurate, as provided by the news source, but is not guaranteed.

To view the original story, visit: https://www.send2press.com/wire/report-offers-multi-faceted-insight-on-self-service-kiosk-industrys-double-digit-growth/

Copr. © 2026 Send2Press® Newswire, Calif., USA. -- REF: S2P STORY ID: S2P136688 NOREL-3B
 

LodeStar report shows nominal year-over-year decline in national average mortgage closing costs

Decrease closely correlates with national home price trends, illustrating how closing costs impact housing affordability

CONSHOHOCKEN, Pa., June 30, 2026 (SEND2PRESS NEWSWIRE) — LodeStar Software Solutions (LodeStar), the leading provider of mortgage closing cost and fee data, today announced the release of its Year-Over-Year Mortgage Closing Cost Report covering 2024 versus 2025. The report analyzes distinct mortgage quotes across all 50 states and the District of Columbia (D.C.), drawn from the company’s closing cost calculator platform. Nationally, purchase loan closing costs declined by 2.9%, driven largely by falling home prices, which reduced transfer tax burdens across many markets. In total, 28 states saw closing costs decrease, while 23 states experienced increases.

LodeStar Software Solutions
Image caption: LodeStar Software Solutions.

The most dramatic single-market shift occurred in D.C., where closing costs dropped 21.1%. Because D.C. has one of the highest transfer tax rates in the country, the significant decrease in the average purchase price here had a compounding effect on closing costs, though the area still has the highest dollar-value closing costs nationally. Conversely, home prices in Delaware rose modestly, pushing closing costs up by 4.5%, keeping it the most expensive state as a percentage of sale price at 3.06%.

Other key findings from LodeStar’s 2024 v. 2025: Year-Over-Year Mortgage Closing Cost Report include:

  • An 7.8% surge in refinance volume, with refi closing costs averaging less than half of purchase closing costs;
  • Higher-than-average refinance closing costs for New York and Florida borrowers, driven by taxes structured around the loan or note amount, rather than a property transfer, which then applies to both purchase and refinance transactions; and
  • A growing trend of recording fees being redirected to fund non-real-estate programs, such as affordable housing and homelessness services, with little to no borrower visibility.

“The connection between closing costs and housing affordability is often overshadowed by other components to the equation, like interest rates and down payments,” said Ron Carvalho, director of data operations at LodeStar. “However, our data shows that decisions made at the state level on recording taxes and document fees have a direct impact on borrowers’ total financial ability to purchase or refinance their home. Knowing what’s happening with these costs helps lenders provide accurate guidance to their borrowers in their homeownership journey.”

Methodology

LodeStar’s dataset is drawn from the company’s closing cost calculator platform, which serves mortgage lenders across the United States. Each record represents a distinct quote (not a funded loan), identified by a unique search ID. Where lenders run multiple quotes for the same loan, only distinct transactions are counted.

Closing costs are reported both inclusive and exclusive of recording fees and transfer taxes, as these components are highly jurisdiction-specific and can create misleading cross-state comparisons when included without context. The report presents averages by state; individual market results may vary based on loan amount, property value, transaction type and title provider selection.

Average figures in this report represent the average of state-level averages and should be interpreted as a benchmark rather than a population-weighted national mean.

View the full report: https://www.lodestarss.com/2026/06/30/2024-vs-2025-year-over-year-mortgage-closing-cost-report/.

About LodeStar Software Solutions

Founded by Jim Paolino and David Spektor in 2013 in response to the complexities of closing cost disclosures, LodeStar is a privately held firm specializing exclusively in mortgage closing costs. From statewide transfer taxes to granular township-level fees, LodeStar ensures accurate, compliant fee disclosures for every loan, serving as a trusted partner in fee management. Driven by its core values of clarity, community and connectivity, the company helps mortgage lenders across the country drive down mortgage production costs through precise disclosures and reliable services. Learn more at https://www.lodestarss.com/.

NEWS SOURCE: LodeStar Software Solutions


This press release was issued on behalf of the news source (LodeStar Software Solutions), who is solely responsible for its accuracy, by Send2Press Newswire. Image, if any, was provided by the news source and not this website or the wire service. Information is believed accurate, as provided by the news source, but is not guaranteed.

To view the original story, visit: https://www.send2press.com/wire/lodestar-report-shows-nominal-year-over-year-decline-in-national-average-mortgage-closing-costs/

Copr. © 2026 Send2Press® Newswire, Calif., USA. -- REF: S2P STORY ID: S2P136572 NOREL-3B


New Building Materials and Distribution Sector Maintains Steady Capital Investment in May 2026

JACKSONVILLE, Fla., June 23, 2026 (SEND2PRESS NEWSWIRE) — Industrial manufacturing activity remained active in May 2026, led by ongoing investment from building materials manufacturers, distributors, and specialty suppliers across the United States and Canada. Industrial SalesLeads research team identified 212 building materials and distribution projects from January through May 2026 signaling consistent and steady demand for warehouse construction, facility modernization, expansion, and operational upgrades.

Industrial SalesLeads, Inc.
Image caption: Industrial SalesLeads, Inc.

The following are selected highlights on new Building Materials & Distribution industry projects from May 2026:

BUILDING MATERIALS & DISTRIBUTION – BY PROJECT TYPE

Industrial Warehouse – 14

Manufacturing/Production – 9

Office Space / Miscellaneous – 10

Processing – 1

Other / Mixed-Use – 4

BUILDING MATERIALS & DISTRIBUTION – BY PROJECT LOCATION (TOP 5 STATES)

Florida – 5

Georgia – 4

Ohio – 4

Texas – 3

Indiana – 2

BUILDING MATERIALS & DISTRIBUTION – BY PROJECT SCOPE/ACTIVITY

New Construction – 10

Renovation / Equipment Upgrade – 29

Expansion – 10

Relocation – 9

BUILDING MATERIALS & DISTRIBUTION EQUIPMENT CATEGORIES IN DEMAND

In the month of May, identified building materials and distribution project managers are procuring the following equipment:

80–89%: Lighting, Compressed Air Systems, HVAC Equipment, Networking/Security Equipment, Mechanical Construction
70–79%: Material Handling/Storage Equipment, Lift Trucks, Loading Dock Equipment, Conveyors, Cranes and Hoists, Fire Protection Equipment
40–49%: Floor Coatings
25–35%: Building Construction, Air Emissions Control Equipment, Packaging Equipment, Heat Exchangers, Control Systems & Instrumentation, Manufacturing Equipment, Building Renovation
18%: Equipment Relocation

Top 10 Tracked Building Materials & Distribution Projects

MARYLAND:

Construction aggregates company is planning for the construction of a 610,000 sf warehouse facility in Odenton, MD. They are currently seeking approval for the project.

ILLINOIS / TEXAS:

Building materials manufacturer is planning to invest $1.2 billion for the construction of a manufacturing and warehouse facility in Orange, TX. They have recently received approval for the project.

TENNESSEE:

Flooring materials supplier is planning to invest $32 million for the construction of a distribution center in Lawrence County, TN. They are currently seeking approval for the project. Completion is slated for late 2027.

WASHINGTON:

Plumbing equipment supplier has recently agreed to pre-lease 276,000 sf of warehouse space in Woodland, WA. Completion is slated for Fall 2026.

MINNESOTA:

Electrical supply distributor has recently started a 124,000 sf expansion and equipment upgrades on their distribution center in Cottage Grove, MN. Completion is slated for early 2028.

OHIO:

HVAC equipment distributor is planning to invest $18 million for the expansion of their warehouse in Miamisburg, OH by 213,000 sf. They are currently seeking approval for the project.

TEXAS:

Pipe support product manufacturer is planning to invest $6 million for the expansion of their manufacturing facility in Houston, TX by 69,000 sf. Completion is slated for Spring 2027.

MINNESOTA:

Specialty building materials manufacturer is planning to invest $5 million for the expansion of their manufacturing facility in Elk River, MN by 40,000 sf. They have recently received approval for the project.

GEORGIA:

Building materials manufacturer is expanding and planning for the renovation of an additional 23,000 sf of office space in Atlanta, GA.

MICHIGAN:

Specialty building materials supplier is planning for the expansion of their manufacturing and office facility in Romulus, MI by 33,000 sf. They are currently seeking approval for the project.

LARGEST PLANNED PROJECT

The largest project tracked in May 2026 is owned by USG Corporation. The building materials manufacturer is planning to invest $1.2 billion for the construction of a manufacturing and warehouse facility at 1750 IP Way Road in Orange, TX. They have recently received approval for the project.

ABOUT INDUSTRIAL SALESLEADS, INC.

Since 1959, Industrial SalesLeads, based in Jacksonville, FL is a leader in delivering industrial capital project intelligence and prospecting services for sales and marketing teams to ensure a predictable and scalable pipeline. Our Industrial Market Intelligence, IMI identifies timely insights on companies planning significant capital investments such as new construction, expansion, relocation, equipment modernization and plant closings in industrial facilities. The Outsourced Prospecting Services, an extension to your sales team, is designed to drive growth with qualified meetings and appointments for your internal sales team. Visit us at https://salesleadsinc.com/.

Each month, our team provides hundreds of industrial reports within a variety of industries.

https://www.salesleadsinc.com/data-solutions/industrial-project-reports/

https://www.salesleadsinc.com/blog/

NEWS SOURCE: Industrial SalesLeads Inc


This press release was issued on behalf of the news source (Industrial SalesLeads Inc), who is solely responsible for its accuracy, by Send2Press Newswire. Image, if any, was provided by the news source and not this website or the wire service. Information is believed accurate, as provided by the news source, but is not guaranteed.

To view the original story, visit: https://www.send2press.com/wire/new-building-materials-and-distribution-sector-maintains-steady-capital-investment-in-may-2026/

Copr. © 2026 Send2Press® Newswire, Calif., USA. -- REF: S2P STORY ID: S2P136387 NOREL-3B


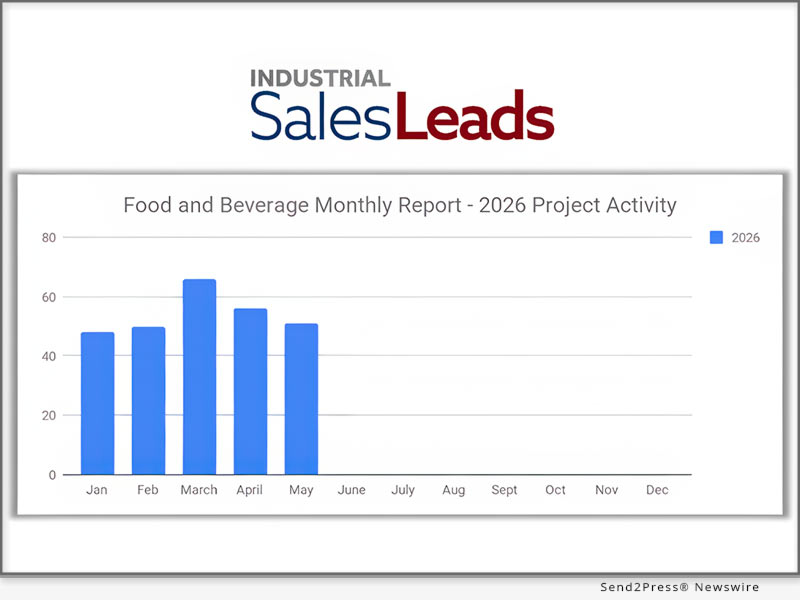
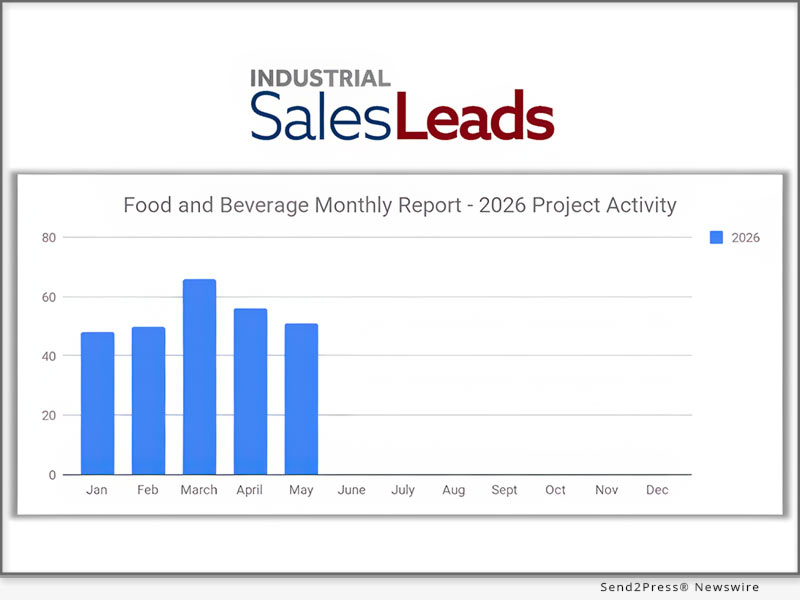
Food and Beverage Remains Steady in 2026, While May Projects Rise 19.2% Year-Over-Year

JACKSONVILLE, Fla., June 16, 2026 (SEND2PRESS NEWSWIRE) — Industrial SalesLeads today released the May 2026 results from its monthly report tracking planned capital investment activity in the Food and Beverage industry. The report monitors new construction, facility expansion, and major equipment upgrade projects throughout North America. Research identified 51 new Food and Beverage projects in May 2026, representing an 8.5% increase from the 47 projects reported during the same period in 2025. Processing facility projects also continued to grow, rising 9.4% year-over-year from 32 projects in May 2025 to 35 projects in May 2026.

Food and Beverage Remains Steady in 2026, While May Projects Rise 19.2% Year-Over-Year
Image caption: Food and Beverage Remains Steady in 2026, While May Projects Rise 19.2% Year-Over-Year.

The following are selected highlights on new Food and Beverage industry construction news.

FOOD AND BEVERAGE PROJECT TYPE

Processing Facilities – 35 New Projects

Distribution and Industrial Warehouse – 21 New Projects

FOOD AND BEVERAGE PROJECT SCOPE/ACTIVITY

New Construction – 12 New Projects

Expansion – 16 New Projects

Renovations/Equipment Upgrades – 26 New Projects

Plant Closing – 4 New Projects

FOOD AND BEVERAGE PROJECT LOCATION (TOP 10 STATES)

Michigan – 8

New York – 6

California – 5

North Carolina – 3

Wisconsin – 3

Alabama – 2

Connecticut – 2

Georgia – 2

Indiana – 2

Louisiana – 2

INDUSTRIAL EQUIPMENT CATEGORIES IN DEMAND

In the month of May, identified industrial manufacturing project managers are procuring the following equipment:

80% – 83% – Lighting, compressed air systems, material handling/storage, lift trucks

73% – 76% – Cranes & hoists, conveyors, networking/security equipment, HVAC

60% – 69% – loading dock equipment, mechanical construction, fire protection, control systems and instrumentation

52%- 56% – Air emissions control equipment, packaging equipment, process equipment, heat exchangers, tank/vessels, floor coating

LARGEST PLANNED PROJECT

During the month of May, our research team identified 2 new Food and Beverage facility construction projects with an estimated value of $100 million or more.

The largest project is owned by American Sugar Refining, Inc., who is investing $200 million and has recently started the expansion and equipment upgrades on their processing facility in ARABI, LA. Completion is slated for 2028.

TOP 10 TRACKED FOOD AND BEVERAGE PROJECTS

NEW YORK:

Food product mfr. is planning to invest $170 million for the expansion of their processing and warehouse facility in AVON, NY. They are currently seeking approval for the project. Construction will occur in phases, with completion of the 1st phase slated for Spring 2028.

CALIFORNIA:

Beverage mfr. is planning to invest $68 million for the expansion of their processing facility in SAN LEANDRO, CA. They are currently seeking approval for the project.

MICHIGAN:

Specialty beverage mfr. is planning to invest $56 million for the renovation and equipment upgrades on a 100,000 sf processing facility at 220 N. Alloy Dr. in FENTON, MI. They are currently seeking approval for the project.

INDIANA:

Beverage company is planning to invest $35 million for the expansion and equipment upgrades on their processing facility at 5000 W. 25th St. in INDIANAPOLIS, IN. They are currently seeking approval for the project. Construction is expected to start in late 2026.

CALIFORNIA:

Meat product mfr. is planning to invest $30 million for the expansion and equipment upgrades on their processing facilities in VERNON, CA and SAN BERNARDINO, CA. They are currently seeking approval for the project.

MINNESOTA:

Specialty restaurant chain is planning for the construction of a 75,000 sf processing, warehouse, and office facility in LAKEVILLE, MN. They are currently seeking approval for the project. Construction is expected to start in Summer 2026 and they will relocate their regional operations upon completion.

NORTH CAROLINA:

Beverage company is planning for the renovation and equipment upgrades on a recently acquired 177,000 sf warehouse at 1302 N. Salisbury Ave. in SALISBURY, NC. They are currently seeking approval for the project.

ALABAMA:

Food products mfr. is planning to invest $14 million for the expansion and equipment upgrades on their processing facility in BRUNDIDGE, AL. They are currently seeking approval for the project.

CALIFORNIA:

Food processing company is planning for the renovation and equipment upgrades on a recently leased 91,000 sf processing facility in MOUNTAIN HOUSE, CA. They will consolidate their operations upon completion.

WISCONSIN:

Frozen desserts and ice cream mfr. is planning for the renovation and equipment upgrades on a recently leased 43,000 sf of processing space at 5404 S. Pennsylvania Ave. in CUDAHY, WI. They are currently seeking approval for the project.

About Industrial SalesLeads, Inc.

Since 1959, Industrial SalesLeads, based in Jacksonville, FL is a leader in delivering industrial capital project intelligence and prospecting services for sales and marketing teams to ensure a predictable and scalable pipeline. Our Industrial Market Intelligence, IMI identifies timely insights on companies planning significant capital investments such as new construction, expansion, relocation, equipment modernization and plant closings in industrial facilities. The Outsourced Prospecting Services, an extension to your sales team, is designed to drive growth with qualified meetings and appointments for your internal sales team. Visit us at https://salesleadsinc.com/.

Each month, our team provides hundreds of industrial reports within a variety of industries.

More information:

https://www.salesleadsinc.com/data-solutions/industrial-project-reports/

https://www.salesleadsinc.com/industry/food-and-beverage/

https://www.salesleadsinc.com/blog/

NEWS SOURCE: Industrial SalesLeads Inc


This press release was issued on behalf of the news source (Industrial SalesLeads Inc), who is solely responsible for its accuracy, by Send2Press Newswire. Image, if any, was provided by the news source and not this website or the wire service. Information is believed accurate, as provided by the news source, but is not guaranteed.

To view the original story, visit: https://www.send2press.com/wire/food-and-beverage-remains-steady-in-2026-while-may-projects-rise-19-2-year-over-year/

Copr. © 2026 Send2Press® Newswire, Calif., USA. -- REF: S2P STORY ID: S2P136242 NOREL-3B


HotDeals Code Verification Feature Expands Across 23 Markets to Strengthen Coupon Transparency

HotDeals Consumer Savings Index data shows growing consumer preference for verified promo codes over unvalidated discount listings

SAN FRANCISCO, Calif., June 10, 2026 (SEND2PRESS NEWSWIRE) — Data from the HotDeals Consumer Savings Index indicates that code-level verification is reshaping how consumers interact with online coupons. Two weeks after launch, the verification system now covers more than 38,000 merchant pages and over 400,000 promo codes across 23 international markets.

HotDeals
Image caption: HotDeals.

The expansion signals a shift in consumer expectations: shoppers increasingly look for evidence that a code works before attempting to apply it at checkout, rather than relying on trial and error.

KEY FINDINGS

According to the HotDeals Consumer Savings Index:

  • Verification coverage: The system tracks 400,000+ promo codes across 38,000+ merchant pages in 23 markets. In the U.S. alone, 15,422 merchant pages and 217,129 codes are monitored.
  • Consumer trust signals: Of all tracked codes in the U.S., approximately 35,000 currently meet the threshold to display verification badges, backed by nearly 3.7 million savings records collected from real transactions.
  • Geographic variation: France (4,177 merchants, 32,403 codes) and Germany (4,694 merchants, 37,140 codes) represent the largest European coverage, with the U.K. (5,835 merchants, 43,628 codes) leading in merchant count outside the U.S.
  • Global savings data: Across all 23 markets, the system has accumulated nearly 9 million savings records within two weeks, providing a growing dataset for code validation.

MARKET COVERAGE

Top five markets by verification coverage:

  • United States: 15,422 merchants, 217,129 codes
  • United Kingdom: 5,835 merchants, 43,628 codes
  • Germany: 4,694 merchants, 37,140 codes
  • France: 4,177 merchants, 32,403 codes
  • Australia: 1,393 merchants, 9,487 codes

Additional markets include Canada, Brazil, Netherlands, Spain, Italy, Poland, Denmark, Japan, and 10 others across Europe and Asia-Pacific.

HOW CODE VERIFICATION WORKS

The HotDeals Consumer Savings Index draws from two independent data streams:

  1. Aggregated Transaction Outcomes — The system tracks which codes produce confirmed results at checkout, scoring each code based on recent activity frequency across the platform.
  2. Brand Expert Testing — Category-specific testers validate codes directly on merchant websites, confirming discount amounts, eligibility conditions, and active status.

Codes meeting both thresholds receive a verification indicator visible to shoppers before they attempt to use the code.

WHY IT MATTERS

A significant portion of promo codes listed across the web are expired, restricted, or no longer functional. This creates a negative experience for consumers who spend time testing codes that ultimately fail at checkout.

Code Verification addresses this trust gap by surfacing real transaction data alongside each listing, allowing consumers to make informed decisions about which codes to try.

“The pattern we observe is consistent across markets,” noted the HotDeals Research Team. “Consumers want evidence that a discount works, not just a promise. Verification changes the coupon experience from guesswork to informed selection.”

About HotDeals

HotDeals (https://www.hotdeals.com/) is a verified coupon platform where real users test promo codes so shoppers don’t have to. The HotDeals Consumer Savings Index tracks coupon effectiveness and consumer savings behavior across 23 countries.

Learn more: https://www.hotdeals.com/

NEWS SOURCE: HotDeals


This press release was issued on behalf of the news source (HotDeals), who is solely responsible for its accuracy, by Send2Press Newswire. Image, if any, was provided by the news source and not this website or the wire service. Information is believed accurate, as provided by the news source, but is not guaranteed.

To view the original story, visit: https://www.send2press.com/wire/hotdeals-code-verification-feature-expands-across-23-markets-to-strengthen-coupon-transparency/

Copr. © 2026 Send2Press® Newswire, Calif., USA. -- REF: S2P STORY ID: S2P136133 NOREL-3B


Industrial Manufacturing Project Activity Climbs 7.6% MoM, Reaching 156 New Planned Projects in May 2026

Texas, Indiana, and California led the nation in new project activity

JACKSONVILLE, Fla., June 9, 2026 (SEND2PRESS NEWSWIRE) — Industrial SalesLeads announced today that planned capital investment activity in the Industrial Manufacturing sector continued its upward momentum in May 2026, with research identifying 156 new planned industrial projects across North America, a 7.6% increase compared to April.

Industrial Manufacturing Project Activity Climbs 7.6% MoM, Reaching 156 New Planned Projects in May 2026
Image caption: Industrial Manufacturing Project Activity Climbs 7.6% MoM, Reaching 156 New Planned Projects in May 2026.

Manufacturing and production facilities accounted for the majority of activity with 138 new projects, while distribution and industrial warehouse developments contributed an additional 66 projects. Texas, Indiana, and California led the nation in new project activity, while 20 major projects valued at more than $100 million highlighted continued confidence in long-term industrial growth and investment.

The following are selected highlights on new Industrial Manufacturing industry construction news.

Industrial Manufacturing – By Project Type

Manufacturing/Production Facilities – 138 New Projects

Distribution and Industrial Warehouse – 66 New Projects

Industrial Manufacturing – By Project Scope/Activity

New Construction – 36 New Projects

Expansion – 49 New Projects

Renovations/Equipment Upgrades – 78 New Projects

Plant Closings – 14 New Projects

Industrial Manufacturing – By Project Location (Top 10 States)

Texas – 16

Indiana – 15

California – 14

Michigan – 8

New York – 8

Ohio – 8

Pennsylvania – 7

Arizona – 6

North Carolina – 6

Wisconsin – 6

Illinois – 5

Industrial Equipment Categories in Demand

In the month of May, identified industrial manufacturing project managers are procuring the following equipment:

75% – 79% – Lighting, compressed air systems, material handling/storage, lift trucks, networking/security equipment

70% – 74% – HVAC Equipment, conveyors, cranes and hoists, mechanical construction

60% – 69% – Fire protection, loading dock equipment, control systems & instruments, air emissions control, heat exchangers, packaging equipment, manufacturing equipment

39% – Floor coatings

Largest Planned Project

During the month of May, our research team identified 20 new Industrial Manufacturing facility construction projects with an estimated value of $100 million or more.

The largest project is owned by JetZero, who is planning to invest $5 billion for the construction of an 8 million sf manufacturing facility at Piedmont Triad International Airport in GREENSBORO, NC. They have recently received approval for the project.

Top 10 Tracked Industrial Manufacturing Projects

INDIANA:

Pharmaceutical company is planning to invest $5 billion for the expansion of their two processing facilities in LEBANON, IN. They are currently seeking approval for the project.

TEXAS:

Automotive mfr. is planning to invest $2 billion for the expansion of their manufacturing facility in SAN ANTONIO, TX. They are currently seeking approval for the project.

TEXAS:

Building materials mfr. is planning to invest $1.2 billion for the construction of a manufacturing and warehouse facility at 1750 IP Way Road in ORANGE, TX. They have recently received approval for the project.

NORTH CAROLINA:

Pharmaceutical company is planning to invest $1 billion for the construction of a processing, laboratory, and office campus in DURHAM, NC. They are currently seeking approval for the project.

TEXAS:

Electronic equipment mfr. is planning to invest $876 million for the construction of a 1 million sf manufacturing facility in FORT WORTH, TX. They are currently seeking approval for the project.

MISSOURI:

Battery mfr. is planning to invest $400 million for the expansion and equipment upgrades on their manufacturing facility in ST. JOSEPH, MO. They are currently seeking approval for the project.

ALABAMA:

Power transformer mfr. is planning to invest $300 million for the construction of a 600,000 sf manufacturing and warehouse facility in MUSCLE SHOALS, AL. They are currently seeking approval for the project. Completion is slated for early 2028.

NORTH CAROLINA:

Aerospace component mfr. is planning to invest $300 million for the construction of two manufacturing facilities totaling 272,000 sf in MONROE, NC. They are currently seeking approval for the project.

NEW JERSEY:

Pharmaceutical ingredient mfr. is planning to invest $200 million for the renovation and equipment upgrades on a recently acquired 320,000 sf processing and office facility in FLANDERS, NJ. They are currently seeking approval for the project.

CALIFORNIA:

Commercial EV mfr. is planning to invest $140 million for the renovation and equipment upgrades on battery manufacturing facilities in GARDEN GROVE, CA AND CYPRESS, CA. They are currently seeking approval for the project.

About Industrial SalesLeads, Inc.

Since 1959, Industrial SalesLeads, based in Jacksonville, FL is a leader in delivering industrial capital project intelligence and prospecting services for sales and marketing teams to ensure a predictable and scalable pipeline. Our Industrial Market Intelligence, IMI identifies timely insights on companies planning significant capital investments such as new construction, expansion, relocation, equipment modernization and plant closings in industrial facilities. The Outsourced Prospecting Services, an extension to your sales team, is designed to drive growth with qualified meetings and appointments for your internal sales team. Visit us at https://salesleadsinc.com/.

BLOG: https://www.salesleadsinc.com/blog

NEWS SOURCE: Industrial SalesLeads Inc


This press release was issued on behalf of the news source (Industrial SalesLeads Inc), who is solely responsible for its accuracy, by Send2Press Newswire. Image, if any, was provided by the news source and not this website or the wire service. Information is believed accurate, as provided by the news source, but is not guaranteed.

To view the original story, visit: https://www.send2press.com/wire/industrial-manufacturing-project-activity-climbs-7-6-mom-reaching-156-new-planned-projects-in-may-2026/

Copr. © 2026 Send2Press® Newswire, Calif., USA. -- REF: S2P STORY ID: S2P136058 NOREL-3B


Optimal Blue report: Purchase market remains resilient as pull-through rates weaken

More than four out of five mortgage locks were tied to purchase transactions in May, but conversion rates declined across both purchase and refinance pipelines

PLANO, Texas, June 9, 2026 (SEND2PRESS NEWSWIRE) — Optimal Blue today released its May 2026 Market Advantage mortgage data report, which found that mortgage activity continued to cool as higher rates weighed on both purchase and refinance demand. Total rate-lock volume declined 9% month over month (MoM) but remained 7% higher year over year (YoY). Purchase activity continued to dominate production, accounting for just over 81% of total lock volume, while refinance share fell to 19%, its lowest level since June 2025.

Optimal Blue’s May 2026 Market Advantage mortgage data report
Image caption: Optimal Blue’s May 2026 Market Advantage mortgage data report.

Mortgage rates moved higher in May, with the Optimal Blue Mortgage Market Indices (OBMMI) 30-year conforming fixed rate increasing 13 basis points (bps) month over month to 6.44%. The 10-year Treasury yield rose 5 bps to 4.45%, while the spread between the 10-year Treasury and the 30-year mortgage rate widened to just under 200 bps.

“Purchase activity continues to be the loan purpose leader in spite of affordability pressures,” said Mike Vough, senior vice president of corporate strategy at Optimal Blue. “More than four out of five mortgage locks were tied to purchase transactions in May, but the more notable shift may be what happened after borrowers locked. Pull-through rates declined across both purchase and refinance pipelines, which tells us borrowers are closely monitoring changes in the rate market.”

Secondary market activity reflected shifting execution preferences in May. Agency mortgage-backed securities (MBS) executions declined to 41% of funded loan sales, while cash executions increased to 32%. Mortgage servicing rights (MSRs) for conforming 30-year loans increased 7 bps to 1.36%, representing a 5.44 multiple.

“We saw lenders continue to balance different execution options during May,” Vough said. “Agency MBS share declined while cash executions gained ground, reflecting the impact of agency execution strategies and/or specified pay-up impacts.”

Key findings from the Market Advantage report, derived from direct-source mortgage lock and secondary market data, include:

Volume trends and market composition

  • Refi demand retreats: Refinance share declined to 19% of total lock volume in May, its lowest level since June 2025. Rate-and-term refinance volume fell 34% MoM but remained 46% higher YoY, while cash-out refinance volume declined 13% MoM but remained 7% higher YoY.
  • Purchase share exceeds 80%: Purchase loans accounted for over 81% of total lock volume in May. Purchase lock volume declined 5% MoM but remained 3% higher YoY.
  • Conforming share continues decline: Conforming share declined to just under 49% of total lock volume in May after falling below 50% for the first time in April. FHA share increased to 19%, non-conforming rose to 19%, VA declined to 13% and USDA held at 1%.
  • Non-QM share expands: Non-qualified mortgage loans accounted for 9% of total lock volume in May, up 83 bps MoM and 207 bps YoY.
  • Borrowers continue turning to ARMs: Adjustable-rate mortgages accounted for 11% of total production in May, the highest level since October 2022 outside of March 2026.
  • Property mix favors single-family homes: Single-family homes represented 64% of production in May, while planned unit developments (PUDs), a proxy for new construction activity, accounted for 28% of volume. Condo share declined to 6%.

Rates and pricing

  • Mortgage-to-Treasury spread widens: The OBMMI 30-year conforming fixed rate increased 13 bps MoM to 6.44%. Jumbo rates rose 27 bps to 6.70%, FHA rates increased 21 bps to 6.27% and VA rates climbed 15 bps to 6.06%. The 10-year Treasury yield increased 5 bps to 4.45%, while the mortgage-to-Treasury spread widened to just under 200 bps.
  • Servicing values gain ground: MSRs for conforming 30-year loans increased 7 bps to 1.36%, representing a 5.44 multiple moving in line with OBMMI.
  • Execution spreads diverge: Best-efforts-to-mandatory spreads held at 39 bps for conventional 30-year products and increased 4 bps to 47 bps for conventional 15-year products. Government 30-year spreads decreased 1 bp to 11 bps.
  • Top-tier pricing share declines: The share of loans sold at the highest price tier declined 208 bps to 77%, while fourth-tier-or-lower executions increased 86 bps to 6%. Third-tier share declined 18 bps to 4%.

Channel and execution

  • Agency MBS executions retreat: Hedged loan sales to agency MBS declined 349 bps to 41% of funded loan sales.
  • Cash executions gain share: Cash executions increased 362 bps to 32% of funded loan sales.
  • Investor count returns to 14: Investor participation declined to 14 in May after reaching 15 in April.

Product mix and borrower profiles

  • First-time buyer participation softens: First-time homebuyers accounted for 44% of conforming purchase locks, 70% of FHA purchase locks and 44% of VA purchase locks, reflecting modest declines across all three major product categories.
  • DTI ratios show little change: Purchase debt-to-income ratios remained relatively stable, with conforming at 36.4%, FHA at 43.6% and VA at 42.8%.
  • Credit profiles remain stable: The average purchase credit score held at 731. Conforming borrowers averaged 754, FHA borrowers averaged 677 and VA borrowers averaged 715.
  • Pipeline conversion weakens: Purchase pull-through fell 539 bps MoM to 76.7% and declined 636 bps YoY. Refinance pull-through dropped 1,332 bps MoM to 65.3% but remained 304 bps higher YoY.
  • Loan balances edge higher: The average locked loan amount increased to $395,536 from $394,046 in April, while average loan-to-value (LTV) was 81.6%. Average loan amounts ranged from $917,568 in greater San Francisco to $307,833 in Cincinnati, while regional LTVs ranged from 68.7% in greater San Francisco to 89.1% in San Antonio.

To view the full May 2026 Market Advantage report, complete the free subscription form: https://engage.optimalblue.com/market-advantage.

Subscribers receive a report PDF each month with the latest data. Members of the press are eligible for special, advance access each month and should contact Alexandra Kreuter to be added to the media list.

About the Market Advantage Report

Optimal Blue issues the Market Advantage mortgage report each month to provide insight into U.S. mortgage trends and drivers of lending profitability. Data is sourced from the Optimal Blue PPE, which is used to price and lock more than one-third of all mortgages nationwide, and Optimal Blue’s hedging and loan trading system, which supports approximately 40% of loans hedged and sold into the secondary market. As the leader in mortgage capital markets technology, Optimal Blue has a direct view of both origination and secondary market activity and the interconnectedness of the two. Unlike self-reported survey data, Optimal Blue’s direct-source data accurately reflect the in-process loans in lenders’ pipelines and secondary market executions. Visit Optimal Blue’s website to subscribe to receive the free report each month.

Nothing herein shall be construed as, nor is Optimal Blue providing, any legal, trading, hedging or financial advice.

About Optimal Blue

Optimal Blue powers profitability across the mortgage capital markets ecosystem. As the industry’s only end-to-end capital markets platform, our technology, data and integrations bridge the primary and secondary markets to help lenders of all sizes maximize performance – from pricing accuracy to margin protection and every step in between. Backed by over 20 years of proven expertise, our modern, cloud-native technology delivers the real-time automation, actionable data and seamless connectivity lenders need to navigate market volatility and scale for growth. To learn more about how Optimal Blue delivers measurable ROI, visit OptimalBlue.com.

MULTIMEDIA

Image link for media: https://www.Send2Press.com/300dpi/26-0609-s2p-opblue-rep-300dpi.webp

Image caption: Optimal Blue’s May 2026 Market Advantage mortgage data report.

NEWS SOURCE: Optimal Blue


This press release was issued on behalf of the news source (Optimal Blue), who is solely responsible for its accuracy, by Send2Press Newswire. Image, if any, was provided by the news source and not this website or the wire service. Information is believed accurate, as provided by the news source, but is not guaranteed.

To view the original story, visit: https://www.send2press.com/wire/optimal-blue-report-purchase-market-remains-resilient-as-pull-through-rates-weaken/

Copr. © 2026 Send2Press® Newswire, Calif., USA. -- REF: S2P STORY ID: S2P136037 NOREL-3B


99 New Pharmaceutical Biotechnology and Healthcare Projects Drive Major Facility Investments in April 2026

JACKSONVILLE, Fla., May 27, 2026 (SEND2PRESS NEWSWIRE) — Industrial manufacturing activity remained strong in April 2026, led by sustained investment from the pharmaceutical, medical device, biotechnology, and healthcare sectors. Industrial SalesLeads research team identified 60 pharmaceutical, medical device, and biotechnology projects, along with 39 healthcare-related projects, signaling continued demand for facility modernization, expansion, and operational upgrades across the U.S. and Canada.

Industrial SalesLeads, Inc.
Image caption: Industrial SalesLeads, Inc.

The following are selected highlights on new Life Science industry news:

LIFE SCIENCES – BY PROJECT TYPE

Pharmaceutical, Medical Device, Biotechnology – 60

Healthcare – 39

LIFE SCIENCES – BY PROJECT LOCATION (TOP 5 STATES)

California – 12

Massachusetts – 11

Virginia – 10

Texas – 8

Michigan – 6

LIFE SCIENCES – BY PROJECT SCOPE/ACTIVITY

Renovation/Equipment Upgrade – 76

Relocation – 60

Expansion/Equipment Upgrade – 14

New Construction – 8

LIFE SCIENCES EQUIPMENT CATEGORIES IN DEMAND

In the month of April, identified life sciences project managers are procuring the following equipment:

80–89%: Lighting (85.9%), Networking/Security Equipment (82.8%)

40–49%: Building Renovation (47.5%)

10–19%: Compressed Air Systems, HVAC Equipment, Mechanical Construction, Fire Protection Equipment, Material Handling/Storage Equipment, Building Construction, Loading Dock Equipment, Conveyors, Heat Exchangers, Control Systems & Instrumentation

9%: Floor Coatings

7%: Air Emissions Control Equipment, Packaging Equipment, Tanks/Vessels – Stainless, Equipment Relocation

TOP 10 TRACKED LIFE SCIENCES PROJECTS

FLORIDA:

Healthcare provider is planning to invest $55 million for new construction of a 14,500sf medical and office in FL. They are currently seeking approval for the project.

GEORGIA:

Healthcare service provider has recently started a 317,000 sf expansion and renovation of their hospital in Cumming, GA. Completion is slated for late 2028.

OHIO:

Biotechnology company is planning to invest $18 million for the expansion and renovation of their warehouse, office, and laboratory facility in OH. They are currently seeking approval for the project. Construction is expected to start in Summer 2026.

MASSACHUSETTS:

Medical device manufacturer is planning for an expansion of their manufacturing facility in MA. They are currently seeking approval for the project.

MINNESOTA:

Pharmaceutical company is planning for the expansion and equipment upgrades on their processing facility in MN. They are currently seeking approval for the project.

MISSOURI:

Pharmaceutical company is planning for the construction of a processing facility in MO. They are currently seeking approval for the project.

NORTH CAROLINA:

Specialty healthcare service provider is planning to invest $2.7 million for the renovation of 10,000 sf of medical and office space in NC. They are currently seeking approval for the project.

NEW JERSEY:

Healthcare service provider is planning to invest $600 million for a 444,000 sf expansion of their hospital in NJ. They are currently seeking approval for the project.

NORTHERN CALIFORNIA:

Healthcare service provider is planning to invest $8 million for the renovation of a recently leased 39,000 sf of medical and office space at CA. They have recently received approval for the project.

NEW YORK:

Healthcare service provider is investing $21 million for the expansion and renovation of their medical and office facilities in NY. Completion is slated for late 2026.

LARGEST PLANNED PROJECT

The largest project is owned by Shine Technologies. Medical isotope technology company is constructing a processing facility in Janesville, WI. Completion is slated for Summer 2027.

ABOUT INDUSTRIAL SALESLEADS, INC.

Since 1959, Industrial SalesLeads, based in Jacksonville, FL is a leader in delivering industrial capital project intelligence and prospecting services for sales and marketing teams to ensure a predictable and scalable pipeline. Our Industrial Market Intelligence, IMI identifies timely insights on companies planning significant capital investments such as new construction, expansion, relocation, equipment modernization and plant closings in industrial facilities. The Outsourced Prospecting Services, an extension to your sales team, is designed to drive growth with qualified meetings and appointments for your internal sales team. Visit us at https://salesleadsinc.com/.

Each month, our team provides hundreds of industrial reports within a variety of industries.

Learn more at:

https://www.salesleadsinc.com/data-solutions/industrial-project-reports/

https://www.salesleadsinc.com/blog/

NEWS SOURCE: Industrial SalesLeads Inc


This press release was issued on behalf of the news source (Industrial SalesLeads Inc), who is solely responsible for its accuracy, by Send2Press Newswire. Image, if any, was provided by the news source and not this website or the wire service. Information is believed accurate, as provided by the news source, but is not guaranteed.

To view the original story, visit: https://www.send2press.com/wire/99-new-pharmaceutical-biotechnology-and-healthcare-projects-drive-major-facility-investments-in-april-2026/

Copr. © 2026 Send2Press® Newswire, Calif., USA. -- REF: S2P STORY ID: S2P135750 NOREL-3B


ACES Q4 and CY 2025 Mortgage QC Industry Trends Report shows critical defect rate falls to annual low

Income/Employment remained the largest single contributor to defects in 2025

DENVER, Colo., May 20, 2026 (SEND2PRESS NEWSWIRE) — ACES Quality Management® (ACES), a leading provider of enterprise quality management and control software for the financial services industry, announced the release of its quarterly ACES Mortgage QC Industry Trends Report covering Q4 2025 and the full calendar year (CY) 2025. The report analyzes post-closing quality control data derived from the ACES Quality Management & Control® software.

ACES Quality Management
Image caption: ACES Quality Management® (ACES).

Key findings from the Q4 and CY 2025 ACES Mortgage QC Industry Trends Report include:

  • The overall Q4 2025 critical defect rate fell to 1.38%, a 22.91% decrease from 1.79% in Q3 2025, marking the first quarterly decline after three consecutive quarters of increases.
  • CY 2025’s average critical defect rate was 1.50%, essentially flat from CY 2024’s 1.52% (-1.32%).
  • Legal/Regulatory/Compliance returned to the top defect category in Q4 2025, rising 30% from 18.97% to 24.66%. This marks the second time it has led all categories since Q4 2024 and its third consecutive quarterly increase.
  • Income/Employment fell from the top spot for only the second time since Q4 2024, declining 21% to 21.52%.
  • For CY 2025, Borrower/Mortgage Eligibility climbed 291.58% year over year, and Credit rose 166.13%, reflecting a migration toward eligibility-driven defects as borrowers stretched to qualify in a constrained affordability environment.
  • Refinance review share nearly doubled year over year in CY 2025, rising from 11.14% to 21.04%, while refinance defect share more than doubled from 15.30% to 32.20%.
  • By loan product type, FHA defect share remained elevated relative to review share at 30.86% for CY 2025, and VA defect share rose for the second consecutive quarter in Q4, warranting continued segment-specific QC focus.

“Lenders ended 2025 on a strong note, with Q4 delivering a meaningful drop in the critical defect rate and the full-year average holding essentially flat versus 2024,” said Nick Volpe, executive vice president at ACES Quality Management. “But the year’s defining shift toward eligibility-driven defects as refinance activity returned indicates that disciplined documentation and consistent eligibility decisioning will define quality in 2026.”

Findings for the Q4 and CY 2025 ACES Mortgage QC Industry Trends Report are based on post-closing quality control data derived from the ACES Quality Management and Control® benchmarking system and incorporate data from prior quarters, where applicable. All reviews and defect data evaluated for the report were based on loan audits selected by lenders for full file reviews. The Mortgage QC Industry Trends Reports are available for download, free of charge, at https://www.acesquality.com/resources/reports.

About ACES Quality Management

ACES Quality Management is the leading provider of enterprise quality management and control software for the financial services industry. The nation’s most prominent lenders, servicers and financial institutions rely on ACES Quality Management & Control® Software to improve audit throughput and quality while controlling costs, including:

  • Over 70% of the top 20 independent mortgage lenders;
  • 7 of the top 10 loan servicers;
  • 14 of the top 30 banks; and
  • 7 of the top 15 credit unions in the United States.

ACES also supports multiple state housing authorities and mortgage insurers, a government-sponsored enterprise (GSE) and dozens of third-party QC service providers that collectively serve hundreds of financial institutions.

Unlike other quality control platforms, ACES Flexible Audit Technology® enables independent mortgage lenders and financial institutions to easily manage and customize the system to their specific needs without relying on IT or outside resources. With ACES’ AI-powered capabilities, audit teams can translate complexity into clear insights and accelerate performance.

Using a customer-centric approach, ACES clients get responsive support and access to our experts to maximize their investment. For more information, visit www.acesquality.com or call 1-800-858-1598.

LOGO link for media (svg): https://www.acesquality.com/assets/images/aces-logo.svg

NEWS SOURCE: ACES Quality Management


This press release was issued on behalf of the news source (ACES Quality Management), who is solely responsible for its accuracy, by Send2Press Newswire. Image, if any, was provided by the news source and not this website or the wire service. Information is believed accurate, as provided by the news source, but is not guaranteed.

To view the original story, visit: https://www.send2press.com/wire/aces-q4-and-cy-2025-mortgage-qc-industry-trends-report-shows-critical-defect-rate-falls-to-annual-low/

Copr. © 2026 Send2Press® Newswire, Calif., USA. -- REF: S2P STORY ID: S2P135606 NOREL-3B


From Ferrara to Anheuser-Busch: 56 Food & Beverage Industrial Projects Advance in April 2026

The pipeline spans bakeries, beverage companies, meat processors, dairy operations, produce facilities, and specialty ingredient manufacturers

JACKSONVILLE, Fla., May 19, 2026 (SEND2PRESS NEWSWIRE) — Industrial SalesLeads announced today the April 2026 results. The month saw weaker activity across the food and beverage sector than the previous month. April 2026 saw 56 newly identified planned industrial capital projects ranging from poultry farm construction and brewery renovations to large-scale candy and ingredient manufacturing facilities.

From Ferrara to Anheuser-Busch: 56 Food & Beverage Industrial Projects Advance in April 2026
Image caption: From Ferrara to Anheuser-Busch: 56 Food & Beverage Industrial Projects Advance in April 2026.

The pipeline spans bakeries, beverage companies, meat processors, dairy operations, produce facilities, and specialty ingredient manufacturers, with Ferrara’s $675 million candy campus in South Carolina and ABF Ingredients’ $270 million processing facility in Wisconsin. Across all identified food and beverage projects, decision-makers are actively procuring equipment with Stainless Tanks & Vessels, Process Equipment, and Packaging Equipment above 60% of the capital projects.

The following are selected highlights on new Food and Beverage industry construction news.

Top Industrial Equipment Categories in Demand

During the month of April, identified industrial manufacturing project leaders are procuring the following equipment:

  • 90% – 99% Material Handling / Storage Equipment, Lift Trucks, Compressed Air Systems Lighting and Networking / Security Equipment, and HVAC Equipment
  • 80% – 89% Loading Dock Equipment, Conveyors, Cranes & Hoists, Mechanical Construction, and Fire Protection Equipment
  • 70% – 79% Air Emissions Control Equipment, Packaging Equipment, Process Equipment, Heat Exchangers, and Control Systems & Instrumentation
  • 60% – 69% Tanks / Vessels – Stainless
  • 50% – 59% floor coatings
  • 40% – 49% Building Construction, Tanks / Vessels – All Types
  • 30% – 39% building renovations
  • 10% – 19% equipment relocation

Food and Beverage Project Location (Top 10 States)

Florida – 6

North Carolina – 5

Pennsylvania – 3

Connecticut – 2

Georgia – 2

Illinois – 2

Indiana – 2

Kentucky – 2

Massachusetts – 2

Missouri – 2

Food and Beverage Project Type

Processing Facilities – 36 New Projects

Distribution and Industrial Warehouse – 27 New Projects

Food and Beverage Project Scope/Activity

New Construction – 18 New Projects

Expansion – 10 New Projects

Renovations/Equipment Upgrades – 28 New Projects

Plant Closing – 8 New Projects

Top 10 Tracked Food and Beverage Projects

WISCONSIN:

Specialty ingredient mfr. is planning to invest $270 million for the construction of a 144,000 sf processing facility in EAU CLAIRE, WI. They are currently seeking approval for the project. Construction will occur in 3 phases.

TEXAS:

Non-profit organization is planning to invest $145 million for the construction of a 305,000 sf warehouse, processing, and office facility at 2121 W. Mt. Houston Rd. in HOUSTON, TX. They are currently seeking approval for the project. They will relocate their operations upon completion in late 2027.

CALIFORNIA:

Non-profit organization and food bank is planning to invest $115 million for the construction of a 215,000 sf warehouse, cold storage, and office facility at 4553 1st St. in SAN JOSE, CA. They have recently received approval for the project and will consolidate their operations upon completion in 2027.

IOWA:

Food processing company is planning to invest $75 million for the renovation and equipment upgrades on a 281,000 sf processing and warehouse facility at 401 Des Moines St. in WEBSTER CITY, IA. They are currently seeking approval for the project.

TEXAS:

Restaurant chain is planning to invest $50 million for the construction of an 86,000 sf distribution center at 407 Business Park Boulevard in LUBBOCK, TX. They have recently received approval for the project. Completion is slated for Spring 2027.

MISSOURI:

Food products mfr. is planning to invest $38.5 million for the expansion and equipment upgrades on their processing and warehouse facility in ST. LOUIS, MO. Completion is slated for Fall 2026.

OHIO:

Bakery products and equipment mfr. is planning to invest $33 million for the construction of a 175,000 sf processing facility at 1700 E. 17th Ave. in COLUMBUS, OH. They are currently seeking approval for the project.

NEW YORK:

Specialty food products mfr. is planning to invest $19 million for the renovation and equipment upgrades on a recently acquired 55,000 sf processing facility at 1800 Motor Pkwy. in ISLANDIA, NY. They are currently seeking approval for the project.

KENTUCKY:

Nutritional supplement mfr. is planning to invest $11.4 million for the renovation and equipment upgrades on a laboratory, processing, warehouse, and office facility in ERLANGER, KY. They are currently seeking approval for the project.

ARIZONA:

Nutritional supplement mfr. is planning for the renovation and equipment upgrades on a recently acquired 70,000 sf processing facility in PHOENIX, AZ. They are currently seeking approval for the project.

Largest Planned Project

During the month of April, our research team identified 4 new Food and Beverage facility construction projects with an estimated value of $100 million or more.

The largest project is owned by Ferrara Candy Company, who is planning to invest $675 million for the construction of a 750,000 sf processing, warehouse, and office campus in ORANGEBURG, SC. They have recently received approval for the project. Completion is slated for early 2029.

About Industrial SalesLeads, Inc.

Since 1959, Industrial SalesLeads, based in Jacksonville, FL is a leader in delivering industrial capital project intelligence and prospecting services for sales and marketing teams to ensure a predictable and scalable pipeline. Our Industrial Market Intelligence, IMI identifies timely insights on companies planning significant capital investments such as new construction, expansion, relocation, equipment modernization and plant closings in industrial facilities. The Outsourced Prospecting Services, an extension to your sales team, is designed to drive growth with qualified meetings and appointments for your internal sales team. Visit us at https://salesleadsinc.com/.

Each month, our team provides hundreds of industrial reports within a variety of industries.

Learn more: https://www.salesleadsinc.com/data-solutions/industrial-project-reports/

NEWS SOURCE: Industrial SalesLeads Inc


This press release was issued on behalf of the news source (Industrial SalesLeads Inc), who is solely responsible for its accuracy, by Send2Press Newswire. Image, if any, was provided by the news source and not this website or the wire service. Information is believed accurate, as provided by the news source, but is not guaranteed.

To view the original story, visit: https://www.send2press.com/wire/from-ferrara-to-anheuser-busch-56-food-beverage-industrial-projects-advance-in-april-2026/

Copr. © 2026 Send2Press® Newswire, Calif., USA. -- REF: S2P STORY ID: S2P135564 NOREL-3B


$20 Billion Tesla Semiconductor Plant Headlines 149 New Industrial Capital Projects

JACKSONVILLE, Fla., April 12, 2026 (SEND2PRESS NEWSWIRE) — Industrial SalesLeads released its April 2026 planned capital project spending report and saw a surge in new industrial manufacturing capital projects, with our research team tracking 149 newly identified planned industrial projects ranging from plant expansions and new construction to renovations and equipment upgrades. Leading the month is Tesla’s planned $20 billion semiconductor manufacturing facility in TX, part of a broader wave of industrial capital investment concentrated in Indiana, Texas, Ohio, Alabama, and Michigan. Across all 149 new industrial manufacturing projects, decision-makers are actively procuring equipment.

$20 Billion Tesla Semiconductor Plant Headlines 149 New Industrial Capital Projects
Image caption: $20 Billion Tesla Semiconductor Plant Headlines 149 New Industrial Capital Projects.

The following are selected highlights on new Industrial Manufacturing industry construction news.

Industrial Equipment Categories in Demand

In the month of April, identified industrial manufacturing project managers are procuring the following equipment:

  • 90% – 99% compressed air, lighting, HVAC, heat exchangers, material handling / storage equipment, mechanical construction, fire protection, networking / security and lift trucks.
  • 80% – 89% air emissions control, manufacturing, control systems & instrumentation, conveyors, loading dock and cranes & hoists.
  • 70% – 79% packaging equipment
  • 50% – 59% floor coatings
  • 40% – 49% building construction
  • 20% – 29% building renovations
  • 10% – 19% equipment relocation

Industrial Manufacturing – By Project Location (Top 10 States)

Indiana – 12

Texas – 11

Ohio – 9

Alabama – 8

California – 8

Michigan – 8

Pennsylvania – 8

Illinois – 7

Iowa – 7

New York – 7

Georgia – 6

Industrial Manufacturing – By Project Type

Manufacturing/Production Facilities – 139 New Projects

Distribution and Industrial Warehouse – 76 New Projects

Industrial Manufacturing – By Project Scope/Activity

New Construction – 52 New Projects

Expansion – 35 New Projects

Renovations/Equipment Upgrades – 68 New Projects

Plant Closings – 14 New Projects

Top 10 Tracked Industrial Manufacturing Projects

ALABAMA:

Automotive mfr. is planning to invest $4 billion for the expansion of their manufacturing facility in VANCE, AL. They are currently seeking approval for the project.

VIRGINIA:

Defense contractor is planning to invest $1.3 billion for the expansion and equipment upgrades on their manufacturing facility in CULPEPER, VA. They are currently seeking approval for the project.

ALABAMA:

Electronic component mfr. is planning to invest $500 million for the construction of a 540,000 sf manufacturing, research, and office facility in GUNTERSVILLE, AL. They are currently seeking approval for the project.

SOUTH CAROLINA:

Solar panel mfr. is planning to invest $350 million for the renovation and equipment upgrades on a 620,000 sf manufacturing facility at 1200 Commerce Blvd. in LAURENS, SC. They are currently seeking approval for the project. Completion is slated for Spring 2027.

IOWA:

Kitchen appliance mfr. is planning to invest $196 million for the expansion of their manufacturing facility in CEDAR RAPIDS, IA by 230,000 sf. They have recently received approval for the project.

ILLINOIS:

Bathroom products mfr. is planning for the construction of a 600,000 sf manufacturing, distribution, and office facility in LIBERTYVILLE, IL. They are currently seeking approval for the project and will consolidate their operations upon completion.

MICHIGAN:

Automotive component mfr. is planning to invest $87 million for the construction of a manufacturing facility in AUBURN HILLS, MI. They are currently seeking approval for the project.

WEST VIRGINIA:

Medical device mfr. is planning to invest $81 million for a 65,000 sf expansion and equipment upgrades on their manufacturing facility in LESAGE, WV. They are currently seeking approval for the project.

OHIO:

Home appliance mfr. is planning to invest $60 million for the renovation and equipment upgrades on a 253,000 sf manufacturing facility at 1775 Progress Drive in PERRYSBURG, OH. They are currently seeking approval for the project.

NEBRASKA:

Construction and farming equipment mfr. is expanding and planning to invest $50 million for the renovation and equipment upgrades on their manufacturing facility in GRAND ISLAND, NE. They are currently seeking approval for the project.

Largest Planned Project

During the month of April, our research team identified 13 new Industrial Manufacturing facility construction projects with an estimated value of $100 million or more.

The largest project is owned by Tesla, Inc., who is planning to invest $20 billion for the construction of a semiconductor manufacturing facility in AUSTIN, TX. They are currently seeking approval for the project. Completion is slated for 2028.

About Industrial SalesLeads, Inc.

Since 1959, Industrial SalesLeads, based in Jacksonville, FL is a leader in delivering industrial capital project intelligence and prospecting services for sales and marketing teams to ensure a predictable and scalable pipeline. Our Industrial Market Intelligence, IMI identifies timely insights on companies planning significant capital investments such as new construction, expansion, relocation, equipment modernization and plant closings in industrial facilities. The Outsourced Prospecting Services, an extension to your sales team, is designed to drive growth with qualified meetings and appointments for your internal sales team. Visit us at https://salesleadsinc.com/.

Each month, our team provides hundreds of industrial reports within a variety of industries.

Learn more:

NEWS SOURCE: Industrial SalesLeads Inc


This press release was issued on behalf of the news source (Industrial SalesLeads Inc), who is solely responsible for its accuracy, by Send2Press Newswire. Image, if any, was provided by the news source and not this website or the wire service. Information is believed accurate, as provided by the news source, but is not guaranteed.

To view the original story, visit: https://www.send2press.com/wire/20-billion-tesla-semiconductor-plant-headlines-149-new-industrial-capital-projects/

Copr. © 2026 Send2Press® Newswire, Calif., USA. -- REF: S2P STORY ID: S2P135316 NOREL-3B


Optimal Blue report: Purchase demand holds firm as April lock activity cools

Conforming share drops below 50% for first time since at least January 2018

PLANO, Texas, May 12, 2026 (SEND2PRESS NEWSWIRE) — Optimal Blue today released its April 2026 Market Advantage mortgage data report, which found that mortgage lock activity pulled back after a strong first quarter. Total rate-lock volume declined 9% month over month (MoM) but remained 11% higher year over year (YoY). Purchase lock volume declined just under 2% from March but increased more than 9% from April 2025, continuing to lead production as refinance activity cooled. Rate-and-term refinance volume fell nearly 38% MoM but remained more than 22% higher YoY, while cash-out refinance volume declined 12% MoM but was up 11% YoY. Refinance share slipped to 23% of total volume, down from March but still above year-ago levels.

Optimal Blue's April 2026 Market Advantage mortgage data report
Image caption: Image caption: Optimal Blue’s April 2026 Market Advantage mortgage data report.

Mortgage rates remained elevated throughout April but finished slightly lower by month-end. The Optimal Blue Mortgage Market Indices (OBMMI) 30-year conforming fixed rate, the benchmark for CME Group’s Mortgage Rate futures, ended the month at 6.31%, down 4 basis points (bps) MoM. The 10-year Treasury yield finished April at 4.40%, up 10 bps MoM, while the spread between the 10-year Treasury and the 30-year mortgage rate narrowed to 191 bps as mortgages outperformed.

“April looks more like a cooling from a strong first quarter than a real weakening in borrower demand,” said Mike Vough, senior vice president of corporate strategy at Optimal Blue. “Purchase activity held up well despite rate pressure, while refinance volume reacted more quickly to recent rate moves. That split reinforces how rate-sensitive borrowers remain, even as the spring purchase market continues to show resilience.”

On the secondary side, April data pointed to renewed movement toward agency mortgage-backed securities (MBS) execution. Agency MBS sales increased while bulk loan sales declined, and mortgage servicing rights (MSR) values rose as higher rates reduced expected refinance activity. Investor participation also increased after holding steady for three consecutive months.

“In a higher-rate environment, lenders are paying close attention to where execution value is showing up,” said Vough. “The move toward agency MBS execution, combined with higher MSR values and increased investor participation, continues to prove that lenders need to evaluate all potential execution options to maximize profitability.”

Key findings from the Market Advantage report, derived from direct-source mortgage lock and secondary market data, include:

Volume trends and market composition

  • Refi activity cools: Rate-and-term refinance volume fell nearly 38% MoM but remained more than 22% higher YoY, while cash-out refinance volume declined 12% MoM but rose 11% YoY. Refinance share slipped to 23% of total volume.
  • Purchase activity holds steady: Purchase lock volume declined just under 2% MoM but increased more than 9% YoY, continuing to lead overall production.
  • Conforming share drops below 50%: Conforming share fell just below 50% of total lock volume in April for the first time since Optimal Blue began tracking this metric. FHA share rose to 19%, VA increased to 13%, non-conforming declined to 17% and USDA held steady at 1%.
  • Non-QM share remains elevated: Non-qualified mortgages accounted for 9% of total lock volume in April, up 30 bps MoM and 233 bps YoY, with investor and bank-statement products leading expanded-guideline activity.
  • ARM levels remain elevated: Adjustable-rate mortgages accounted for 10% of total production, down 182 bps MoM but broadly in line with year-ago levels and well above pre-2022 norms.
  • Property mix shifts: Single-family homes represented 64% of production, while planned unit developments, a proxy for new construction activity, declined to 28%, down 42 bps MoM and 326 bps YoY. Condo share also declined to 6%.

Rates and pricing

  • Mortgage rates outperform Treasuries: The OBMMI 30-year conforming fixed rate finished at 6.31%, down 4 bps MoM. Jumbo rates ended at 6.43%, VA rates at 5.90% and FHA rates at 6.06%. The 10-year Treasury increased 10 bps to 4.40%, while the mortgage-to-Treasury spread narrowed to 191 bps.
  • MSR values climb: MSRs rose 5 bps to 1.29%, representing a 5.16 multiple, moving in line with higher rates and lower refinance expectations.
  • Conventional spreads widen: Best-efforts-to-mandatory spreads increased 4 bps for conventional 30- and 15-year products, while government 30-year spreads decreased 3 bps.
  • Lower-tier sales increase: Loans sold to the fourth or lower price tier increased 89 bps to 5%, while third-tier share increased 21 bps.

Channel and execution

  • Agency MBS share increases: Hedged loan sales to agency MBS rose 354 bps to 44%, marking a shift toward securitization executions.
  • Bulk executions decline: Bulk loan sales decreased 257 bps to 25%.
  • Investor count rises: Investor participation increased to 15 in April after holding at 14 for the prior three months.

Product mix and borrower profiles

  • First-time buyers maintain purchase presence: First-time homebuyer share remained nearly flat in April but continued to represent a meaningful share of purchase activity, accounting for 47% of conforming purchase locks, 70% of FHA purchase locks and 45% of VA purchase locks.
  • DTI ratios remain stable: Purchase debt-to-income ratios improved YoY, with conforming at 36.2%, FHA at 43.5% and VA at 42.7%.
  • Credit quality holds firm: The average purchase credit score held at 735, unchanged from March. By product, conforming borrowers averaged 753, FHA borrowers averaged 676 and VA borrowers averaged 716.
  • Pull-through rates improve: Purchase pull-through rose to just over 82%, up 208 bps MoM but down 58 bps YoY. Refinance pull-through increased to just under 79%, up 356 bps MoM and 1,381 bps YoY.
  • Loan amounts decline: The average loan amount was $394,046, down from $401,100 in March and $404,586 in February. The average loan-to-value ratio (LTV) was 81.64%. Loan amounts ranged from $888,871 in greater San Francisco to $302,493 in Cincinnati, while regional LTVs ranged from 71.23% in the Bay Area to 89.05% in San Antonio.

To view the full April 2026 Market Advantage report, complete the free subscription form: https://engage.optimalblue.com/market-advantage.

Subscribers receive a report PDF each month with the latest data. Members of the press are eligible for special, advance access each month and should contact Alexandra Kreuter to be added to the media list.

About the Market Advantage Report

Optimal Blue issues the Market Advantage mortgage report each month to provide insight into U.S. mortgage trends and drivers of lending profitability. Data is sourced from the Optimal Blue PPE, which is used to price and lock more than one-third of all mortgages nationwide, and Optimal Blue’s hedging and loan trading system, which supports approximately 40% of loans hedged and sold into the secondary market. As the leader in mortgage capital markets technology, Optimal Blue has a direct view of both origination and secondary market activity and the interconnectedness of the two. Unlike self-reported survey data, Optimal Blue’s direct-source data accurately reflect the in-process loans in lenders’ pipelines and secondary market executions. Visit Optimal Blue’s website to subscribe to receive the free report each month.

Nothing herein shall be construed as, nor is Optimal Blue providing, any legal, trading, hedging or financial advice.

About Optimal Blue

Optimal Blue powers profitability across the mortgage capital markets ecosystem. As the industry’s only end-to-end capital markets platform, our technology, data and integrations bridge the primary and secondary markets to help lenders of all sizes maximize performance – from pricing accuracy to margin protection and every step in between. Backed by over 20 years of proven expertise, our modern, cloud-native technology delivers the real-time automation, actionable data and seamless connectivity lenders need to navigate market volatility and scale for growth. To learn more about how Optimal Blue delivers measurable ROI, visit OptimalBlue.com.

MULTIMEDIA

Image link for media: https://www.Send2Press.com/300dpi/26-0512-s2p-opblue0526-300dpi.webp

Image caption: Optimal Blue’s April 2026 Market Advantage mortgage data report

NEWS SOURCE: Optimal Blue


This press release was issued on behalf of the news source (Optimal Blue), who is solely responsible for its accuracy, by Send2Press Newswire. Image, if any, was provided by the news source and not this website or the wire service. Information is believed accurate, as provided by the news source, but is not guaranteed.

To view the original story, visit: https://www.send2press.com/wire/optimal-blue-report-purchase-demand-holds-firm-as-april-lock-activity-cools/

Copr. © 2026 Send2Press® Newswire, Calif., USA. -- REF: S2P STORY ID: S2P135303 NOREL-3B


Glancy Wine Education Foundation Releases 2026 Impact Report, Marking Six Years of Progress in Diversifying the Wine Industry

303 scholarships and more than $405,000 distributed since 2020; new data spotlights opportunities to engage Black, Hispanic/Latino, AAPI, and other underrepresented communities in wine

SAN FRANCISCO, Calif., May 8, 2026 (SEND2PRESS NEWSWIRE) — The Glancy Wine Education Foundation (GWEF), a 501(c)(3) nonprofit dedicated to advancing diversity in the wine industry through scholarships for underserved professionals, today released its 2026 Impact Report. The report details the Foundation’s cumulative work since its 2020 founding and introduces newly compiled data on the demographic communities GWEF serves.

Glancy Wine Education Foundation
Image caption: The Glancy Wine Education Foundation (GWEF).

Since inception, GWEF has awarded 303 scholarships and distributed more than $405,000 in grants directly to its wine school partners which include the founding San Francisco Wine School, the International Wine Center in New York and the American Wine School in the Midwest. The Foundation operates with a 9% overhead — less than half the average for U.S. nonprofits — thanks to an all-volunteer board of industry leaders. GWEF holds a Four-Star rating from Charity Navigator and a Platinum Seal of Transparency from Candid.

Key Findings from the 2026 Impact Report

  • Recipient demographics: 61% of GWEF scholarship recipients identify as non-Caucasian, 55.7% are female, 42.8% male, and 2% non-binary.
  • Career outcomes: 67% of recipients have received a promotion following certification, and more than one-third are currently working full-time in the wine and hospitality industries.
  • Earnings impact: Industry data shows that professional wine certification can yield 50–300% salary increases over a career, with sommeliers progressing from $45–60K at entry level to as much as $190K at the Master Sommelier level.
  • Operational efficiency: Funds flow directly to wine school partners — no administrative layers between donors and scholarship recipients. The average GWEF scholarship is $1,477.

THE INDUSTRY GAP GWEF IS WORKING TO CLOSE

While Black, Indigenous, and People of Color make up 40% of the U.S. population, and more than half of Americans under 18 identify as a racial or ethnic minority, the wine industry remains markedly less diverse. Fewer than 1% of U.S. wineries are Black-owned (out of more than 11,000 total), fewer than 1% of winery owners or head winemakers are people of color, and roughly 2% of Black Americans hold leadership roles in wine, according to research from the Association of African American Vintners and Pronghorn Research. Hispanic/Latino professionals — who represent 18.7% of the U.S. population — hold just 4% of Fortune 500 executive officer roles, with comparable underrepresentation across wine. Only 14% of California bonded wineries have women as lead winemakers.

NEW DATA: THE AAPI OPPORTUNITY IN WINE

The 2026 report introduces newly gathered insights on the Asian American and Pacific Islanders (AAPI) wine consumer, according to the Asian Wine Association of America (AWAA). AAPI Americans represent 6.3% of the U.S. population but currently account for only 5% of wine consumption, even as roughly 50% of the AAPI population sits within the Millennial and Gen-X cohorts, with 39% drinking wine weekly, nearly on par with other demographics. Yet only 4% of wine industry executives identify as Asian, even as Asian markets are the fastest-growing demographic for WSET Global certification worldwide.

A MESSAGE FROM THE FOUNDATION PRESIDENT

“The world of wine is a celebration of diversity, and yet the industry itself has been slow to reflect that truth,” said Ana Keller, GWEF Foundation President. “At a moment when wine is competing harder than ever for the attention of younger, more diverse consumers, the case for inclusion has never been more urgent. The professionals who understand those communities, who come from them, are exactly who this industry needs.”

Keller added: “Since 2020, we have funded more than 303 scholarships, and none of it happens without people who believe that those who will shape this industry’s future deserve a real chance to get there. Every donation, at any level, goes directly to a scholarship and to someone whose career, and whose life, will be changed by it.”

IN THE WORDS OF RECIPIENTS

“GWEF made it possible for me to receive the wine training and education I needed to become a Sommelier in a Michelin-starred restaurant,” said Lily Yu, 2020 GWEF scholarship recipient and Private Event Sommelier, formerly of the sommelier team at The Modern in New York City.

“Thanks to GWEF’s assistance and what I learned in the WSET 3, I took over as head sommelier and was soon promoted to Wine Director. I also am a winemaker now,” said Oceano Ordonez, 2021, 2023 and 2024 GWEF scholarship recipient, Wine Director at Donato Enoteca, and GWEF Emeritus Board Member.

“GWEF has been a transformative experience that has profoundly impacted my personal and professional growth. Through GWEF I have gained networking opportunities resulting in great relationships and collaborations within the wine industry,” said Cristian Medina, 2022 and 2024 GWEF scholarship recipient and Sommelier at Shelby’s in Atherton, California.

HOW TO SUPPORT THE MISSION

GWEF welcomes contributions at every level — every dollar donated goes directly to scholarship funding. Corporate sponsorship tiers and named scholarship opportunities are also available, including scholarships established in honor or memory of industry colleagues. Wine schools, industry organizations, and nonprofit partners interested in collaboration are also encouraged to connect.

The full 2026 Impact Report is here.

To donate, sponsor, or partner, visit https://www.glancywineeducationfoundation.org/.

ABOUT THE GLANCY WINE EDUCATION FOUNDATION

The Glancy Wine Education Foundation is a 501(c)(3) tax-exempt nonprofit organization established in 2020 and based in San Francisco, partnering nationally with three schools, the San Francisco Wine School, the International Wine Center and the American Wine School. GWEF is dedicated to assisting underserved communities with scholarships to further their professional wine education, with the goal of raising their earning power and increasing diversity in the wine industry. The Foundation holds a Four-Star Charity Navigator rating and Candid Platinum Seal of Transparency. Federal Tax ID #85-2516009. Learn more at https://www.glancywineeducationfoundation.org/ or follow @glancywineeducationfoundation on Instagram.

MEDIA CONTACT:
Kimberly Noelle Charles, DipWSET | Charles Communications Associates
kimberly@glancywineeducationfoundation.org 415-701-WINE (9463)

LOGO link for media: https://images.squarespace-cdn.com/content/v1/5f4983f8f6a5da1a611120b6/1600653227576-77YOUNZ5DH482BWLWSEJ/GWEF_logo_med.png

NEWS SOURCE: Glancy Wine Education Foundation


This press release was issued on behalf of the news source (Glancy Wine Education Foundation), who is solely responsible for its accuracy, by Send2Press Newswire. Image, if any, was provided by the news source and not this website or the wire service. Information is believed accurate, as provided by the news source, but is not guaranteed.

To view the original story, visit: https://www.send2press.com/wire/glancy-wine-education-foundation-releases-2026-impact-report-marking-six-years-of-progress-in-diversifying-the-wine-industry/

Copr. © 2026 Send2Press® Newswire, Calif., USA. -- REF: S2P STORY ID: S2P135220 NOREL-3B


iEmergent releases 2025 HMDA insights: volume rebounds, but the mortgage market grows more concentrated

Data insights now available in Mortgage MarketSmart show refinance-driven growth amid rising loan sizes

DES MOINES, Iowa, April 29, 2026 (SEND2PRESS NEWSWIRE) — iEmergent, a forecasting and advisory services firm for the financial services, mortgage and real estate industries, has released its analysis of 2025 Home Mortgage Disclosure Act (HMDA) data in Mortgage MarketSmart. Presented by iEmergent CEO Laird Nossuli, the findings point to a market that is regaining momentum after a prolonged downturn, with total volume increasing in 2025. That recovery, however, is uneven. Growth is being driven by refinancing activity and larger loan balances, while competitive gains remain concentrated among a relatively small group of lenders.

iEmergent releases 2025 HMDA insights: volume rebounds, but the mortgage market grows more concentrated
Image caption: iEmergent releases 2025 HMDA insights: volume rebounds, but the mortgage market grows more concentrated.

Top takeaways from 2025 HMDA data:

  1. Refinance activity drove a disproportionate share of volume growth.
    S. lenders originated approximately 6.75 million loans totaling $2.12 trillion in 2025, up from $1.82 trillion in 2024. Refinances accounted for a disproportionate share of that growth, rising to $610.4 billion and representing 29% of total lending volume, compared to 22% the prior year. This shift indicates that recent volume gains are being fueled more by rate-driven activity than by underlying purchase demand.
  2. IMBs extended their lead in both share and growth capture.
    Independent mortgage banks (IMBs) increased their share of originations to 57.8% in 2025, up from 55.8% in 2024, and accounted for 61.9% of total lending volume. Notably, they captured $193 billion of the market’s $303 billion year-over-year growth, far outpacing depository institutions. IMBs also dominated lender rankings, representing 18 of the top 25 institutions by both loan count and dollar volume.
  3. Rising loan sizes continue to pressure affordability.
    Average loan sizes increased across both purchase and refinance segments, with purchase loans rising to $379,600 (from $368,100) and refinance loans to $311,200 (from $272,900). These increases align with persistent inventory constraints and elevated home prices, which are pushing borrowers toward higher balances and further limiting access for more price-sensitive buyers.
  4. Denial rates edged down, but elevated fallout points to ongoing borrower friction.
    While denial rates declined modestly, overall application fallout remained high. Approximately 40% of applications from non-Hispanic White borrowers did not result in funded loans, while fallout exceeded 50% for Black, Native American/Alaskan and Pacific Islander applicants. Increased withdrawals and incomplete applications suggest that affordability constraints and valuation challenges are continuing to disrupt borrower progression through the origination process.
  5. Market concentration remains high, with production concentrated among a small group of lenders.
    The top five lenders accounted for just over 20% of both loan count and total volume in 2025. More broadly, only 47 lenders—roughly 1% of all institutions—originated half of total mortgage volume. This concentration underscores a competitive environment in which scale and operational efficiency are increasingly determining market share outcomes.
  6. Loan purpose mix varies significantly by geography, reinforcing the need for localized strategy.
    Purchase-driven markets in the Sun Belt, such as Houston (71% purchase) and Austin (68% purchase), stand in contrast to coastal markets like Los Angeles (40% refinance) and San Diego (38% refinance). These differences highlight the importance of market-specific strategy, as performance in purchase-heavy regions depends more on execution and affordability positioning than on cyclical refinance opportunities

“2025 HMDA data shows a market that is improving, but not uniformly,” said Nossuli. “Growth is being driven by specific products, borrower segments and geographies, while competitive gains are concentrated among lenders with the scale and strategy to capture them. Understanding where those opportunities exist is critical for lenders planning their next phase of growth.”

Lenders can now benchmark performance and identify growth opportunities
The integration of 2025 HMDA data into Mortgage MarketSmart allows lenders to benchmark their performance against peers across categories such as:

  • Purchase and refi loan volume (units and dollars)
  • Borrower race and ethnicity
  • Loan type and size
  • Borrower income levels
  • Denial reasons by demographic group

With side-by-side comparisons of HMDA data, historical trends and forward-looking forecasts, Mortgage MarketSmart empowers lenders to identify gaps, meet Community Reinvestment Act (CRA) obligations and reach underserved markets.

To explore 2025 HMDA insights in Mortgage MarketSmart, request a demo at https://www.iemergent.com.

About iEmergent

Founded in 2000, iEmergent provides mortgage lending forecasts and analytics to the lending, housing and real estate industries. The company offers an extensive variety of forecast and market intelligence products, including Mortgage MarketSmart, a visualization tool that helps lenders quantify how mortgage markets will change. For more information, visit https://www.iemergent.com.

Tags: @iEmergent

Media Kit:
https://www.iemergent.com/docs/default-source/default-document-library/presskit_digitallinked.pdf

NEWS SOURCE: iEmergent


This press release was issued on behalf of the news source (iEmergent), who is solely responsible for its accuracy, by Send2Press Newswire. Image, if any, was provided by the news source and not this website or the wire service. Information is believed accurate, as provided by the news source, but is not guaranteed.

To view the original story, visit: https://www.send2press.com/wire/iemergent-releases-2025-hmda-insights-volume-rebounds-but-the-mortgage-market-grows-more-concentrated/

Copr. © 2026 Send2Press® Newswire, Calif., USA. -- REF: S2P STORY ID: S2P134985 NOREL-3B


U.S. homebuyer assistance programs increase in Q1 2026 as identified by housing industry authority Down Payment Resource

Program count continues to grow, giving housing industry professionals more ways to support homebuyers

  • 2,679 U.S. homebuyer assistance programs identified in Q1 2026 by housing industry authority Down Payment Resource
  • Down Payment Resource identifies 2,679 homebuyer assistance programs nationwide in Q1 2026

ATLANTA, Ga., April 29, 2026 (SEND2PRESS NEWSWIRE) — Down Payment Resource (DPR), the housing industry authority on homeownership program data and solutions, today released its Q1 2026 Homeownership Program Index (HPI) report, identifying 2,679 programs nationwide. This represents a 2% increase from the previous quarter (2,619 programs), reflecting continued expansion of resources designed to improve affordability and access to homeownership.

U.S. homebuyer assistance programs increase in Q1 2026 as identified by housing industry authority Down Payment Resource
Image caption: U.S. homebuyer assistance programs increase in Q1 2026 as identified by housing industry authority Down Payment Resource.

DPA programs provide meaningful financial support that strengthens borrower profiles. By reducing loan-to-value ratios and covering upfront costs such as down payments, closing costs and rate buydowns, these programs help convert qualified demand into successful homeownership outcomes.

The majority of programs in DPR’s database remain active and available to buyers, with 2,073 programs (77%) currently funded and accessible. As affordability challenges persist, these programs continue to play a critical role in helping lenders qualify borrowers, reduce upfront costs and expand homeownership opportunities.

“Recent data shows buyers are spending more than $31,000 beyond the down payment, often far more than they’d expected,” said Rob Chrane, founder and CEO of Down Payment Resource. “With 62% of programs serving incomes above $100K, DPA is a powerful tool to help qualified buyers move forward without draining their savings, while giving lenders more flexibility to expand access to homeownership.”

KEY Q1 2026 HPI REPORT FINDINGS:

An examination of the 2,679 homeownership programs on April 1, 2026, resulted in the following key findings:

  • Program count continues to climb: The total number of programs increased to 2,679, up from 2,619 in Q4 2025 and 2,509 year over year (YoY), reflecting steady growth in available assistance options. 2,073 programs (77%) are currently active and funded, providing immediate opportunities for homebuyers across the country. By state, California has the highest number of programs (424) and providers (263), followed by Florida (271/174) and Texas (196/103).
  • More programs with no income limits: 284 programs (11%) do not have income restrictions, a 5% increase from the prior quarter, giving lenders greater flexibility to qualify a broader range of borrowers.
  • Second mortgages remain dominant: Second-mortgage programs make up 56% of all program types, offering flexible structures such as deferred or forgivable loans that reduce upfront costs for buyers. Combined assistance programs account for 10% of programs, while first-mortgage programs represent 9%. 220 programs (8%) are grants, which offer significant value because they do not require repayment, an increase of 6% from the prior quarter.
  • Local providers lead program availability: Municipalities account for the largest share of programs at 39% (1,056), up 3% from the prior quarter, followed by nonprofits at 22% (578), also up 3% and state housing finance agencies (HFAs) at 18% (469), up 1%. Local HFAs represent an additional 8% (208 programs), reflecting continued growth in community-based program delivery.
  • Support for first-time and first-generation buyers expands: 1,666 programs (62%) are available to first-time homebuyers, up from 1,639 in the prior quarter, while 33 programs support first-generation buyers, holding steady from last quarter. These programs continue to expand access to homeownership for those entering the market for the first time or without family homeownership history respectively.
  • Incentive programs broaden access: 206 programs offer special incentives based on occupation or borrower characteristics, up from 201 in the prior quarter. There are 71 for educators (34%), 58 for Native American homebuyers (28%), 54 for Veterans (26%) and 50 for protectors such as law enforcement and first responders (24%), reflecting continued support for key community segments.
  • Expanded property and housing options: Programs supporting multi-unit properties (2–4 units) increased to 934 (35%), up from 923 in Q4 2025, while 1,053 programs (39%) now support manufactured housing, up from 1,041 (40%). These trends reflect continued expansion of more flexible and affordable homeownership pathways, including options that support rental income potential and lower-cost housing alternatives.

A more detailed analysis of the Q1 2026 HPI findings, including infographics and examples of the programs described in this release, can be found on DPR’s website at: https://downpaymentresource.com/professional-resource/down-payment-assistance-continues-to-expand-in-q1-2026-reaching-2679-programs-nationwide/

For a complete list of homebuyer assistance programs by state, visit: https://downpaymentresource.com/wp-content/uploads/2026/04/HPI-state-by-state-data.Q12026.pdf

Members of the media are encouraged to contact DPR for data specific to their reporting needs.

METHODOLOGY:

Published quarterly, DPR’s HPI surveys the funding status, eligibility rules and benefits of U.S. homebuyer assistance programs administered by state and local housing finance agencies, municipalities, nonprofits and other housing organizations. DPR communicates with over 1,400 program providers throughout the year to track and update the country’s wide range of homeownership programs, including down payment and closing cost programs, Mortgage Credit Certificates (MCCs) and affordable first mortgages, in the DOWN PAYMENT RESOURCE® database.

ABOUT DOWN PAYMENT RESOURCE:

With a database that tracks over 2,600 programs and toolsets for mortgage lenders, multiple listing services (MLSs) and API users, Down Payment Resource (DPR) is the housing industry’s authority on homeownership program data and solutions, helping housing professionals connect homebuyers with the assistance they need. DPR frequently lends its expertise to nonprofits, housing finance agencies, policymakers, government-sponsored enterprises and trade organizations seeking to improve housing affordability. Its technology is used by seven of the top 25 mortgage lenders, two of the largest real estate listing websites and 600,000 real estate agents. For more information, visit https://downpaymentresource.com/.

X: @DwnPmtResource #downpaymentassistance #downpayment

MULTIMEDIA:

Image link for media: https://www.Send2Press.com/300dpi/26-0429-s2p-dprchart-300dpi.webp

Image caption: U.S. homebuyer assistance programs increase in Q1 2026 as identified by housing industry authority Down Payment Resource

NEWS SOURCE: Down Payment Resource


This press release was issued on behalf of the news source (Down Payment Resource), who is solely responsible for its accuracy, by Send2Press Newswire. Image, if any, was provided by the news source and not this website or the wire service. Information is believed accurate, as provided by the news source, but is not guaranteed.

To view the original story, visit: https://www.send2press.com/wire/u-s-homebuyer-assistance-programs-increase-in-q1-2026-as-identified-by-housing-industry-authority-down-payment-resource/

Copr. © 2026 Send2Press® Newswire, Calif., USA. -- REF: S2P STORY ID: S2P134930 NOREL-3B


Food and Beverage Facilities Are Expanding and Modernizing, with Building Renovations Driving More Than Half of All March 2026 Capital Activity

JACKSONVILLE BEACH, Fla., April 28, 2026 (SEND2PRESS NEWSWIRE) — Industrial SalesLeads tracked 66 food and beverage capital investment projects in March 2026 across more than 25 U.S. states and Canada. From a $125 million meat processing renovation by Carl Buddig & Company to mid-market upgrades in the $1–$10 million range, this month’s data reflects broad and sustained investment spanning breweries, bakeries, meat processors, seafood companies, and specialty food manufacturers.

WHERE FOOD & BEVERAGE CAPITAL PROJECTS ARE SPENDING

Lighting, material handling & storage equipment and lift trucks top the demand list, each appearing in 79–82% of all industrial projects. Compressed air systems and HVAC follow closely at 71%. Mechanical construction is needed in 68% of the identified industrial projects. Loading dock equipment, conveyors, cranes and hoists, and fire protection each appear in 64% of industrial projects. These numbers reflect broad facility-wide modernization across the food and beverage sector. For instance, Carl Buddig & Company, investing $125 million to renovate a 195,000 sf meat processing facility in WI with purchasing needs in nearly every category.

Process-specific equipment tells a more targeted story. Control systems and instrumentation appear in 43% of the capital projects. Air emissions control equipment shows up in 39%. Packaging equipment, process equipment, heat exchangers, and stainless tanks each at 36%. These categories are heavily represented in processing and production environments such as breweries, seafood processors, food ingredient manufacturers, and meat plants. Building renovation appears in 54% of projects, suggesting that roughly half of these investments involve structural changes alongside equipment upgrades.

Geographically, projects are distributed across more than 20 U.S. states and into Canada, with no single dominant region.

Food and Beverage Facilities Are Expanding and Modernizing, with Building Renovations Driving More Than Half of All March 2026 Capital Activity
Image caption: Food and Beverage Facilities Are Expanding and Modernizing, with Building Renovations Driving More Than Half of All March 2026 Capital Activity.

FOOD & BEVERAGE INDUSTRIAL PROJECT HIGHLIGHTS

March 2026 food and beverage capital projects span 11 sub-sectors and more than 25 states, ranging from $100M+ expansions to mid-market renovations, with nearly 25% of industrial projects already under construction and seven facility closures creating additional market opportunities.

Food & Beverage Breakdown

  • Projects span pet food, breweries, bakeries, meat processors, beverage distributors, specialty food manufacturers, seafood processors, cheese producers, snack food companies, grocery retailers, and catering services.

Food & Beverage Facility Renovations

  • Three very large industrial food and beverage projects exceed $100M. These include Associated Wholesale Grocers $110M distribution center in LA, Taylor Farms $120M processing expansion in MD and Carl Buddig & Co $125M meat processing facility in WI.
  • Most projects are still early-stage, but activity is accelerating. There are 15 industrial projects in Planning / Design and 7 have received Approval. However, 5 are already In Progress and 1 has broken ground. This means nearly 25% of the industrial projects are actively under construction, suggesting near-term purchasing decisions are imminent for those accounts.

Plant Closures

  • Seven facilities are scheduled for closures by Summer or Fall 2026.
  • Closure projects represent liquidation, asset recovery and equipment resale opportunities.

Mid-Range Food & Beverage Project Investment

  • While the dataset includes both sub-$1M office retrofits and multi-hundred-million processing plant expansions, the most common investment range is $1M–$10M, accounting for 39.4% of the food and beverage projects.
  • 6 projects exceed $100M, representing the largest industrial capital deployment opportunities.

Geographic Region

  • Projects span more than 25 states and Canadian provinces, with no single state accounting for more than ~8% of projects.
  • California, Ohio, and Washington each lead with approximately 6 projects, but the distribution is national.

ABOUT INDUSTRIAL SALESLEADS

Since 1959, Industrial SalesLeads, based in Jacksonville, FL is a leader in delivering industrial capital project intelligence, prospecting services and performance marketing programs for sales and marketing teams to ensure a predictable and scalable pipeline. Our Industrial Market Intelligence identifies timely insights on companies planning significant capital investments such as new construction, expansion, relocation, equipment modernization and plant closings in industrial facilities. The Outsourced Prospecting Services, an extension to your sales team, is designed to drive growth with qualified meetings and appointments for your internal sales team. Performance marketing drives manufacturing sales through targeted campaigns built to deliver high-quality leads and predictable growth. Learn more about our services at https://www.salesleadsinc.com/.

BLOG: https://www.salesleadsinc.com/blog/

NEWS SOURCE: Industrial SalesLeads Inc


This press release was issued on behalf of the news source (Industrial SalesLeads Inc), who is solely responsible for its accuracy, by Send2Press Newswire. Image, if any, was provided by the news source and not this website or the wire service. Information is believed accurate, as provided by the news source, but is not guaranteed.

To view the original story, visit: https://www.send2press.com/wire/food-and-beverage-facilities-are-expanding-and-modernizing-with-building-renovations-driving-more-than-half-of-all-march-2026-capital-activity/

Copr. © 2026 Send2Press® Newswire, Calif., USA. -- REF: S2P STORY ID: S2P134861 NOREL-3B


Food and Beverage Capital Investment Remains Strong in March 2026 with 66 New Projects Spanning Processing, Expansion, and Modernization

This month's research confirms 66 new planned projects across the Food and Beverage sector

JACKSONVILLE BEACH, Fla., April 21, 2026 (SEND2PRESS NEWSWIRE) — Industrial SalesLeads released its March 2026 planned capital project spending report for the Food and Beverage industry, tracking North American capital project activity across new facility construction, expansions, and equipment modernization projects. This month’s research confirms 66 new planned projects across the Food and Beverage sector, led by 34 renovations and equipment upgrades, 20 new construction starts, and 18 expansions.

Food and Beverage Capital Investment Remains Strong in March 2026
Image caption: Food and Beverage Capital Investment Remains Strong in March 2026.

The following are selected highlights on new Food and Beverage industry construction news.

Food and Beverage Project Type

  • Processing Facilities – 42 New Projects
  • Distribution and Industrial Warehouse – 24 New Projects

Food and Beverage Project Scope/Activity

  • New Construction – 20 New Projects
  • Expansion – 18 New Projects
  • Renovations/Equipment Upgrades – 34 New Projects
  • Plant Closing – 7 New Projects

TOP INDUSTRIAL EQUIPMENT CATEGORIES IN DEMAND

89%–90% of the identified Distribution and Supply Chain projects are searching for Lighting, Material Handling/Storage Equipment, and Lift Trucks.

84% of the identified Distribution and Supply Chain projects are searching for Compressed Air Systems and HVAC Equipment.

69%–73% of the identified Distribution and Supply Chain projects are searching for Mechanical Construction, Loading Dock Equipment, Conveyors, Cranes and Hoists.

FOOD AND BEVERAGE PROJECT LOCATION (TOP 10 STATES)

California – 6

Ohio – 6

Washington – 6

Pennsylvania – 4

Mayland – 3

New York – 3

Wisconsin – 3

Alabama – 2

Florida – 2

Georgia – 2

LARGEST PLANNED PROJECT

During the month of March, our research team identified 6 new Food and Beverage facility construction projects with an estimated value of $100 million or more.

The largest project is owned by The Coca-Cola Company, who is planning to invest $650 million for the expansion and equipment upgrades on their processing facility in COOPERSVILLE, MI by 245,000 sf. They are currently seeking approval for the project. Construction is expected to start in early Fall 2026, with completion slated for 2028.

TOP 10 TRACKED FOOD AND BEVERAGE PROJECTS

ARKANSAS:

Diversified food products mfr. is planning to invest $220 million for the expansion and equipment upgrades on their processing facility in FAYETTEVILLE, AR. They are currently seeking approval for the project. Construction is expected to start in late 2026.

SOUTH DAKOTA:

Cheese mfr. is investing $200 million for the expansion and equipment upgrades on their processing facility in BROOKINGS, SD. They are currently seeking approval for the project.

WISCONSIN:

Meat product mfr. is planning to invest $125 million for the renovation and equipment upgrades on a 195,000 sf processing facility on Crocker Ave. in SHEBOYGAN, WI. They have recently received approval for the project.

LOUISIANA:

Food products distributor is planning to invest $110 million for the renovation and equipment upgrades on their distribution center in PEARL RIVER, LA. They are currently seeking approval for the project. Renovations are expected to start in early 2027, with completion slated for late 2027.

INDIANA:

Specialty food product mfr. is expanding and planning to invest $91 million for the construction of a 132,000 sf processing and warehouse facility in INDIANAPOLIS, IN. They are currently seeking approval for the project.

OHIO:

Specialty food product mfr. is planning to invest $85 million for the renovation and equipment upgrades on a 250,000 sf processing facility in BATAVIA TOWNSHIP, OH. They have recently received approval for the project. Construction will occur in phases, with completion of phase 1 slated for early 2027.

MASSACHUSETTS:

Food products mfr. is planning to invest $55 million for a 65,000 sf expansion and equipment upgrades on their processing and warehouse facility in AYER, MA. They are currently seeking approval for the project.

KENTUCKY:

Food processing company is planning to invest $37 million for the construction of a processing facility in COVINGTON, KY. They have recently received approval for the project.

WASHINGTON:

Fruit processing company is planning to invest $25 million for an expansion of their processing facility in PROSSER, WA. They are currently seeking approval for the project.

UTAH:

Bakery company is planning for the expansion of their processing and warehouse facility in PLEASANT VIEW, UT by 115,000 sf. They are currently seeking approval for the project.

ABOUT INDUSTRIAL SALESLEADS, INC.

Since 1959, Industrial SalesLeads, based in Jacksonville, FL is a leader in delivering industrial capital project intelligence and prospecting services for sales and marketing teams to ensure a predictable and scalable pipeline. Our Industrial Market Intelligence, IMI identifies timely insights on companies planning significant capital investments such as new construction, expansion, relocation, equipment modernization and plant closings in industrial facilities. The Outsourced Prospecting Services, an extension to your sales team, is designed to drive growth with qualified meetings and appointments for your internal sales team. Visit us at https://salesleadsinc.com/.

Each month, our team provides hundreds of industrial reports within a variety of industries, including:

LEARN MORE:

https://www.salesleadsinc.com/industry/food-and-beverage/

https://www.salesleadsinc.com/blog/

NEWS SOURCE: Industrial SalesLeads Inc


This press release was issued on behalf of the news source (Industrial SalesLeads Inc), who is solely responsible for its accuracy, by Send2Press Newswire. Image, if any, was provided by the news source and not this website or the wire service. Information is believed accurate, as provided by the news source, but is not guaranteed.

To view the original story, visit: https://www.send2press.com/wire/food-and-beverage-capital-investment-remains-strong-in-march-2026-with-66-new-projects-spanning-processing-expansion-and-modernization/

Copr. © 2026 Send2Press® Newswire, Calif., USA. -- REF: S2P STORY ID: S2P134758 NOREL-3B


U.S. Industrial Manufacturing Sector Tracked 165 New Capital Projects in March 2026, Topping $8.6B in Combined Investment

JACKSONVILLE BEACH, Fla., April 14, 2026 (SEND2PRESS NEWSWIRE) — Industrial SalesLeads released its March 2026 planned capital project spending report for the Industrial Manufacturing industry tracking North American capital project activity across new plant construction, facility expansions, and equipment modernization projects. This month’s research confirms 165 new planned projects across the Industrial Manufacturing sector, led by 82 renovations and equipment upgrades, 56 expansions, and 39 new construction starts.

U.S. Industrial Manufacturing Sector Tracked 165 New Capital Projects in March 2026, Topping $8.6B in Combined Investment
Image caption: U.S. Industrial Manufacturing Sector Tracked 165 New Capital Projects in March 2026, Topping $8.6B in Combined Investment.

The following are selected highlights on new Industrial Manufacturing industry construction news.

Industrial Manufacturing – By Project Type

  • Manufacturing/Production Facilities – 140 New Projects
  • Distribution and Industrial Warehouse – 75 New Projects

Industrial Manufacturing – By Project Scope/Activity

  • New Construction – 39 New Projects
  • Expansion – 56 New Projects
  • Renovations/Equipment Upgrades – 82 New Projects
  • Plant Closings – 14 New Projects

Top Industrial Equipment Categories in Demand

85% of the identified industrial projects are searching for compressed air systems, lighting, HVAC, Material Handling / Storage Equipment, lift trucks and heat exchangers.

79% – 84% of the identified industrial projects are searching for air emissions control equipment, manufacturing equipment, control systems & instrumentation, loading dock equipment, conveyors and cranes & hoists.

Industrial Manufacturing – By Project Location (Top 10 States)

Ohio – 15

Texas – 15

Indiana – 12

Wisconsin – 10

Alabama – 9

Michigan – 8

New York – 7

South Carolina – 7

California – 6

North Carolina – 6

Kentucky – 5

Largest Planned Project

During the month of March, our research team identified 26 new Industrial Manufacturing facility construction projects with an estimated value of $100 million or more.

The largest project is owned by Saronic Technologies, who is planning to invest $3.2 billion for the construction of a manufacturing facility in BROWNSVILLE, TX.

Top 10 Tracked Industrial Manufacturing Projects

These 10 projects span from automotive, battery technology, consumer products, and pharmaceutical manufacturing, with a combined investment value exceeding $8.6B reflecting broad-based capital commitment in March 2026.

GEORGIA:

Pharmaceutical company is planning to invest $2 billion for the construction of a 460,000 sf processing and office campus in DACULA, GA. The project is in the early design phase. Watch Industrial SalesLeads for updates.

MASSACHUSETTS:

Consumer products mfr. is planning to invest $1 billion for the construction of a manufacturing, research, and office facility at 232 A St. in BOSTON, MA. They are currently seeking approval for the project.

TENNESSEE:

Battery component mfr. is considering investing $1 billion for the construction of a manufacturing facility on West 19th Street in CHATTANOOGA, TN. Watch Industrial SalesLeads for updates.

NORTH CAROLINA:

Steel product mfr. is planning to invest $875 million for the construction of a 1.6 million sf manufacturing facility in COEFIELD, NC. They are currently seeking approval for the project.

KENTUCKY:

Automotive mfr. is planning to invest an additional $800 million for the expansion and equipment upgrades on their manufacturing facility in GEORGETOWN, KY. They are currently seeking approval for the project.

OKLAHOMA:

Tissue paper mfr. is planning to invest $775 million for a 1 million sf expansion and equipment upgrades on their manufacturing and warehouse facility in INOLA, OK. They are currently seeking approval for the project. Completion is slated for Spring 2028.

PENNSYLVANIA:

Medical isotopes company is planning to invest $450 million for the construction of a 250,000 sf processing facility in PHILADELPHIA, PA. They are currently seeking approval for the project. Completion is slated for 2029.

ILLINOIS:

Transportation equipment mfr. is planning to invest $450 million for the renovation and equipment upgrades on two manufacturing facilities in JOLIET, IL. They have recently received approval for the project. Completion is slated for 2027.

ALABAMA:

Automotive component mfr. is planning to invest $430 million for the construction of a 1 million sf manufacturing and warehouse facility in GADSDEN, AL. They are currently seeking approval for the project.

OHIO:

Automotive component mfr. is planning to invest $313 million for a 215,000 sf expansion and equipment upgrades on their manufacturing facility in BELLEVUE, OH. Completion is slated for Fall 2027.

About Industrial SalesLeads, Inc.

Since 1959, Industrial SalesLeads, based in Jacksonville, FL is a leader in delivering industrial capital project intelligence and prospecting services for sales and marketing teams to ensure a predictable and scalable pipeline. Our Industrial Market Intelligence, IMI identifies timely insights on companies planning significant capital investments such as new construction, expansion, relocation, equipment modernization and plant closings in industrial facilities. The Outsourced Prospecting Services, an extension to your sales team, is designed to drive growth with qualified meetings and appointments for your internal sales team. Visit us at https://salesleadsinc.com/.

Each month, our team provides hundreds of industrial reports within a variety of industries, including:

https://www.salesleadsinc.com/industry/industrial-manufacturing/

https://www.salesleadsinc.com/blog/

NEWS SOURCE: Industrial SalesLeads Inc


This press release was issued on behalf of the news source (Industrial SalesLeads Inc), who is solely responsible for its accuracy, by Send2Press Newswire. Image, if any, was provided by the news source and not this website or the wire service. Information is believed accurate, as provided by the news source, but is not guaranteed.

To view the original story, visit: https://www.send2press.com/wire/u-s-industrial-manufacturing-sector-tracked-165-new-capital-projects-in-march-2026-topping-8-6b-in-combined-investment/

Copr. © 2026 Send2Press® Newswire, Calif., USA. -- REF: S2P STORY ID: S2P134550 NOREL-3B


Optimal Blue report: Purchase demand lifts mortgage lock activity as rates rise

Lock volume rises 13% month over month as spring buying season gains traction

PLANO, Texas, April 14, 2026 (SEND2PRESS NEWSWIRE) — Optimal Blue today released its March 2026 Market Advantage mortgage data report, reflecting resilient mortgage activity as purchase demand strengthened despite higher rates. Total rate-lock volume rose 13% month over month (MoM) and 26% year over year (YoY). Purchase activity led the month, with purchase lock volume up 38% from February and 20% from March 2025. Cash-out refinance volume increased 9% MoM and 21% YoY, while rate-and-term refinance volume declined 34% from February but remained more than 66% higher YoY. Refinance share finished March at 28% of total production, down from earlier in the year but still well above 2025 levels.

Optimal Blue's March 2026 Market Advantage mortgage data report
Image caption: Optimal Blue’s March 2026 Market Advantage mortgage data report.

​​Mortgage rates moved higher across all major products in March. The Optimal Blue Mortgage Market Indices (OBMMI) 30-year conforming fixed rate, the benchmark for CME Group’s Mortgage Rate futures, ended the month at 6.35%, up 45 basis points (bps) from February. Jumbo, VA and FHA rates also increased during the month. The 10-year Treasury yield ended March at 4.30%, up 33 bps, while the spread between the 10-year Treasury and the 30-year rate widened to 205 bps.

“Purchase demand is carrying the market forward even as rates move higher,” said Mike Vough, senior vice president of corporate strategy at Optimal Blue. “That’s a strong sign for the spring market, especially with refinance share still at 28%, well above where it spent most of 2025.”

On the secondary side, March data reflected modest shifts in execution. Best-efforts-to-mandatory spreads tightened for 30-year products, while agency cash window executions increased 100 bps and securitization activity eased. Mortgage servicing rights (MSR) values also rose 6 bps as higher rates reduced refinance expectations.

“In a higher-rate environment, lenders have to be more deliberate about how they execute and where they find value,” Vough said. “We saw some movement toward the cash window in March, but the more telling signal was MSRs moving higher as refinance expectations came down. That’s the market adjusting to a higher-rate backdrop.”

Key findings from the Market Advantage report, derived from direct-source mortgage lock and secondary market data, include:

Volume trends and market composition

  • Refinance share eases: Refinances accounted for 28% of total lock volume in March as purchase demand accelerated. Rate-and-term refinance volume declined 34% MoM but remained more than 66% higher YoY, while cash-out refinance volume increased 9% MoM and 21% YoY.
  • Purchase share expands: Purchase locks accounted for just over 71% of total volume in March, with purchase activity rising 38% MoM and 20% YoY as the market moved deeper into the spring selling season.
  • Conforming’s majority narrows: Conforming share declined to just over 50% of total volume in March. FHA and non-conforming share each increased to 18%, while VA share eased to 13% and USDA held steady at 1%.
  • ARM usage climbs: Adjustable-rate mortgages accounted for 12% of total production in March, up 162 bps MoM and reaching the highest mark since October 2022.
  • PUD share rises: Planned unit developments, a proxy for new construction activity, rose to 28% of total volume in March, up 75 bps MoM but down 413 bps YoY.

Rates and pricing

  • Rates move higher: The OBMMI 30-year conforming fixed rate rose 45 bps to 6.35%. Jumbo rates increased 41 bps, VA rates rose 44 bps and FHA rates climbed 21 bps. The 10-year Treasury yield increased 33 bps to 4.30%, while the mortgage-to-Treasury spread widened to 205 bps.
  • MSR values rise: MSRs for conforming 30-year loans increased 6 bps to 1.24%, representing a 4.97 multiple, as higher rates reduced refinance expectations.
  • Execution spreads tighten: Best-efforts-to-mandatory spreads decreased 3 bps for conventional 30-year loans and 5 bps for government 30-year loans, while the conforming 15-year spread increased 7 bps.
  • Top pricing share slips: The share of loans sold at the highest price tier declined 100 bps to 79%, while loans sold in the fourth (or worse) tier decreased 100 bps to 4%.

Channel and execution

  • MBS share slips: Agency mortgage-backed securities (MBS) securitizations accounted for 41% of hedged executions, down slightly from 42% the prior month.
  • Cash window gains ground: Hedged loan sales to the agency cash window rose 100 bps to 28%.

Product mix and borrower profiles

  • First-time buyer share remains high: First-time homebuyers represented 46% of conforming purchase locks and more than 70% of FHA volume in March, while VA first-time buyer share held near 46%. Conforming first-time buyer share was up 3 points over the past three months and 1 point year over year.
  • Borrower profiles remain stable: Debt-to-income (DTI) ratios for purchase loans were 36.3% for conforming loans, 43.3% for FHA and 42.7% for VA in March. Conforming purchase DTI was essentially flat from February, while FHA and VA purchase DTIs moved modestly lower. All three remained below year-ago levels. The average purchase FICO was 732.
  • Loan balances stay elevated: Average loan amount declined to just over $401,000 from $404,586 in February but remained well above year-ago levels. The average loan-to-value ratio (LTV) was 81.32%. Loan amounts ranged from $888,536 in greater San Francisco to $306,283 in Indianapolis, while regional LTVs ranged from 69.88% in the Bay Area to 89.47% in San Antonio.

To view the full March 2026 Market Advantage report, complete the free subscription form: https://engage.optimalblue.com/market-advantage.

Subscribers receive a report PDF each month with the latest data. Members of the press are eligible for special, advance access each month and should contact Leslie Colley to be added to the media list.

About the Market Advantage Report

Optimal Blue issues the Market Advantage mortgage report each month to provide insight into U.S. mortgage trends and drivers of lending profitability. Data is sourced from the Optimal Blue PPE, which is used to price and lock more than one-third of all mortgages nationwide, and Optimal Blue’s hedging and loan trading system, which supports approximately 40% of loans hedged and sold into the secondary market. As the leader in mortgage capital markets technology, Optimal Blue has a direct view of both origination and secondary market activity and the interconnectedness of the two. Unlike self-reported survey data, Optimal Blue’s direct-source data accurately reflect the in-process loans in lenders’ pipelines and secondary market executions. Visit Optimal Blue’s website to subscribe to receive the free report each month.

Nothing herein shall be construed as, nor is Optimal Blue providing, any legal, trading, hedging or financial advice.

About Optimal Blue

Optimal Blue powers profitability across the mortgage capital markets ecosystem. As the industry’s only end-to-end capital markets platform, our technology, data and integrations bridge the primary and secondary markets to help lenders of all sizes maximize performance – from pricing accuracy to margin protection and every step in between. Backed by over 20 years of proven expertise, our modern, cloud-native technology delivers the real-time automation, actionable data and seamless connectivity lenders need to navigate market volatility and scale for growth. To learn more about how Optimal Blue delivers measurable ROI, visit OptimalBlue.com.

MULTIMEDIA

Image link for media: https://www.Send2Press.com/300dpi/26-0414-s2p-opblue-300dpi.webp

Image caption: Optimal Blue’s March 2026 Market Advantage mortgage data report

NEWS SOURCE: Optimal Blue


This press release was issued on behalf of the news source (Optimal Blue), who is solely responsible for its accuracy, by Send2Press Newswire. Image, if any, was provided by the news source and not this website or the wire service. Information is believed accurate, as provided by the news source, but is not guaranteed.

To view the original story, visit: https://www.send2press.com/wire/optimal-blue-report-purchase-demand-lifts-mortgage-lock-activity-as-rates-rise/

Copr. © 2026 Send2Press® Newswire, Calif., USA. -- REF: S2P STORY ID: S2P134536 NOREL-3B


New Industry Research Reveals Direct Mail’s Influence As Digital Performance Volatility Continues

MINNEAPOLIS, Minn., March 26, 2026 (SEND2PRESS NEWSWIRE) — As marketers navigate fluctuating digital costs and crowded online environments, new industry research shows direct mail standing out for its consistency, engagement, and ability to drive measurable action. Commissioned by Franklin Madison Direct and conducted by research firm Circlebox, the 2026 Direct Mail Marketing Benchmark Report analyzes national survey data from U.S. marketers and consumers to assess direct mail performance and its role within today’s omnichannel strategies.

SeQuel Response is now Franklin Madison Direct
Image caption: Franklin Madison Direct.

The findings highlight a channel evolving beyond performance validation, with marketers focusing less on volume and more on targeted execution, personalization, and coordinated digital experiences. Key findings from the 2026 report include:

  • Direct mail performance remains strong: 98% of marketers say their direct mail performance improved or held steady over the past 12 months, with more than half reporting gains.
  • Consumer engagement is sustained: 79% of consumers engage with the mail they receive.
  • Targeting remains a challenge: Marketers cite data access and targeting precision as their most persistent pain points.
  • Mail drives real action: About one in five consumers report making a purchase in the past year as a result of receiving relevant direct mail.
  • Confidence is growing: 95% of marketers plan to maintain or increase their direct mail investment over the next 12 months, an increase from last year, making it one of the few channels with clear budget momentum.

The 2026 Direct Mail Marketing Benchmark Report is available for download at https://franklinmadisondirect.com/e-books/direct-mail-report/

About Franklin Madison Direct

Franklin Madison Direct is a leading direct response advertising agency, providing performance-driven marketing solutions to help consumer and insurance brands reach their best audience and achieve exceptional growth. Franklin Madison Direct is ranked as a top marketing agency in Minneapolis, Minnesota, and has been named to the Inc. 5000 list of fastest-growing private companies in the U.S. https://franklinmadisondirect.com/

For any business and/or media inquiries, please contact Brittany Barth at brittany.barth@franklin-madison.com.

Logo link for media: https://www.Send2Press.com/300dpi/25-0424-s2p-fmdirect-300dpi.jpg

NEWS SOURCE: Franklin Madison Direct


This press release was issued on behalf of the news source (Franklin Madison Direct), who is solely responsible for its accuracy, by Send2Press Newswire. Image, if any, was provided by the news source and not this website or the wire service. Information is believed accurate, as provided by the news source, but is not guaranteed.

To view the original story, visit: https://www.send2press.com/wire/new-industry-research-reveals-direct-mails-influence-as-digital-performance-volatility-continues/

Copr. © 2026 Send2Press® Newswire, Calif., USA. -- REF: S2P STORY ID: S2P134249 NOREL-3B


MarketWise Advisors study finds mortgage lenders increase efficiency by over $1,000 per loan with Optimal Blue

Hundreds of surveyed lenders report major improvements in accuracy, operational capacity, execution and risk reduction, including 1,193% ROI for PPE clients

PLANO, Texas, March 17, 2026 (SEND2PRESS NEWSWIRE) — Optimal Blue today announced key results of an independent analysis by consulting advisory firm MarketWise Advisors LLC quantifying the operational and financial efficiencies of its end-to-end capital markets platform and the significant value it generates per loan. The study found that mortgage lenders using Optimal Blue technology are more efficient and competitive. Optimal Blue mortgage lenders report an average net financial benefit of $1,006 per loan, reflecting measurable gains in execution quality, error reduction, automation and operational efficiency.

Optimal Blue logo.
Image caption: Optimal Blue logo.

Across the institutions studied, lenders reported improvements in accuracy, performance, operational capacity and capital markets execution. The analysis highlights both the cumulative value created when lenders adopt multiple capabilities across the Optimal Blue ecosystem and the value delivered by specific Optimal Blue technology solutions when combined with individual strategic decision-making. By combining pricing, execution, data and secondary marketing tools within a single platform, lenders are able to scale loan production more efficiently and respond more effectively to changing market conditions.

“In mortgage capital markets, every basis point matters. That is why our core goal is providing our clients with data that enables them to be more competitive. When lenders are gaining more than $1,000 per loan and achieving a rate of return of $12 for every $1 spent, that’s more than efficiency, that is operational advantage,” said Joe Tyrrell, CEO of Optimal Blue. “This independent analysis confirms what our clients experience every day: when lenders have better technology, including use-case specific AI tools backed by real expertise, the impact shows up on their bottom line.

“The results confirm that Optimal Blue delivers substantial, measurable value – contributing to clients’ ability to scale efficiently, improve execution, manage risk and achieve strong returns across the ecosystem,” said Jordan Brown, founding principal and CEO of MarketWise Advisors.

KEY FINDINGS

The analysis identified five key findings showing how lenders use Optimal Blue’s solutions to make smarter decisions, resulting in:

  • Average positive impact of more than $1,000 per loan. Across the Optimal Blue ecosystem, lenders reported an average net benefit of $1,006 per closed loan.
  • Nearly 45% increase in operational capacity. Respondents reported a 43.65% improvement in their ability to manage higher loan volume using Optimal Blue technology without requiring an increase in staff.
  • More than $400 per-loan impact from advanced hedging and secondary marketing tools. The AI-driven hedging and trading capabilities supporting strategic execution, trade optimization, MSR valuation and mark-to-market reporting produced an average financial impact of $401.43 per loan.
  • 12X ROI for Optimal Blue PPE clients. Clients reported a median return on investment of 1,193%, representing nearly $12 returned for every dollar spent with Optimal Blue.
  • Universal error reduction with measurable financial impact. 100% of survey respondents indicated that Optimal Blue helps reduce errors, with 98% reporting financial benefits tied to improved pricing and eligibility accuracy. These benefits represent an average additional gain of $181.83 per loan.

Full results from the study will be available in early May. To explore these key findings in greater detail or be notified when the full report is released, visit https://www2.optimalblue.com/2026-study.

METHODOLOGY

The ROI analysis was conducted by MarketWise Advisors LLC, a consulting advisory firm specializing in financial services technology and benchmarking. The study evaluated client-reported outcomes across Optimal Blue’s end-to-end platform, including its Product and Pricing Engine (PPE), hedging and trading solutions, data solutions and Comergence counterparty oversight solution.

More than a quarter of Optimal Blue’s nearly 1,000 unique lender customers participated in the analysis, representing a balanced mix of banks, credit unions, independent mortgage banks and housing authorities. Because Optimal Blue’s client base spans various segments of the mortgage market, the participating institutions collectively provide a representative cross-section of lender types, sizes and business models.

MarketWise Advisors applied a deliberately conservative methodology to assess value delivery, using median production volumes and client-reported outcomes to quantify financial and operational impact while avoiding assumptions that could overstate results.

NOTE ON RESULTS

Results reflect client-reported outcomes collected as part of the MarketWise Advisors analysis. Neither MarketWise Advisors LLC nor Optimal Blue provide any warranty or representation regarding performance outcomes, which rely on clients’ independent business strategies and decision-making. Individual results may vary.

About Optimal Blue

Optimal Blue powers strategic performance across the mortgage capital markets ecosystem. As the industry’s only end-to-end capital markets platform, our technology, data and integrations bridge the primary and secondary markets to help lenders of all sizes optimize performance – from pricing accuracy to margin protection and every step in between. Backed by over 20 years of proven expertise, our modern, cloud-native technology delivers the real-time automation, actionable data and seamless connectivity lenders need to navigate market volatility and scale for growth. To learn more about how Optimal Blue helps deliver measurable ROI, visit OptimalBlue.com.

LOGO link for media: https://www.Send2Press.com/300dpi/25-0811-s2p-opblue-logo-300dpi.jpg

NEWS SOURCE: Optimal Blue


This press release was issued on behalf of the news source (Optimal Blue), who is solely responsible for its accuracy, by Send2Press Newswire. Image, if any, was provided by the news source and not this website or the wire service. Information is believed accurate, as provided by the news source, but is not guaranteed.

To view the original story, visit: https://www.send2press.com/wire/marketwise-advisors-study-finds-mortgage-lenders-increase-efficiency-by-over-1000-per-loan-with-optimal-blue/

Copr. © 2026 Send2Press® Newswire, Calif., USA. -- REF: S2P STORY ID: S2P133956 NOREL-3B


Archive directory unlocks secrets of world’s knowledge repositories

The Guide to Public Archives II is a unique navigational tool ideal for researchers looking for a comprehensive directory to the documents and artifacts of history

LOS ANGELES, Calif., March 17, 2026 (SEND2PRESS NEWSWIRE) — For the first time, journalists and researchers have a searchable directory of over 1,500 of the world’s knowledge repositories. The new publication is from Newsjunkie.net, the data-journalism resource known for its “Who’s Behind the News” reporting. Guide to Public Archives II, a fully revised and expanded directory of the world’s artifact and document repositories, is designed to help journalists and scholars quickly and easily locate essential research materials.

Interactive mapping tool from Guide to Public Archives © Newsjunkie.net
Image caption: Interactive mapping tool from Guide to Public Archives © Newsjunkie.net.

The updated guide now includes a full representation of essential archives from major institutions such as the Library of Congress and the Vatican Apostolic Archive to regional and specialized collections devoted to particular communities, disciplines, and eras, such as the Timorese Resistance Archive. Each entry has been significantly expanded, with richer descriptions, improved structure, and more detailed information on collections, access policies, and contact points.

The Guide to Public Archives II has never been more necessary. It arrives at a moment of heightened urgency around the preservation of public records. As federal agencies remove datasets, government websites are compromised by misinformation, and historical records whitewashed, archivists, researchers, and journalists need a destination untarnished by ideology. The Guide to Public Archives II is a permanent, free reference to the world’s institutions that hold the record of human activity not altered by prejudice or partisanship.

“In the 20th century, the world put its history into archives, libraries, and museums. In the 21st, the collections are being fully digitized, and while this benefits researchers immensely, information on collections is hard to find,” said Gordon Whiting, publisher of Newsjunkie. “The Guide to Public Archives solves that problem. For example, a journalist researching colonial-era Indonesia can see a description of the collections held at the Nationaal Archief in The Netherlands, which hold exactly the records they need, and how to access them.”

Whiting added, “Institutional archives preserve everything from ancient census records and scientific observations to modern newspapers, photographs, and government documents. Our goal was to develop a navigation tool that allows these wonderful materials to be easily found.”

Newsjunkie’s Guide to Public Archives II helps match researchers to specialized repositories that serve not just as custodians of historical materials, but as active centers of documentation, interpretation, and collaboration. Many archives also function as applied research centers. India’s Archives and Research Centre for Ethnomusicology, in Gurugram, produces original field documentation on regional forms of folk music, in addition to managing a collection of historic recordings.

Contributor Dr. Amy Catlin-Jairazbhoy of UCLA notes, “It’s a collaborative educational institution working with local and foreign scholars. I find it very unusual. It’s an applied approach to archiving.”

Future updates will add new search and filtering tools. “The scale of these collections can be overwhelming,” Whiting added. “But they’re critically important. These collections belong to everyone. We’re making every archive discoverable.”

The Guide to Public Archives II is available free of charge at https://www.newsjunkie.net/article/introducing-guide-to-public-archives

The interactive Global Archive Map is at https://www.newsjunkie.net/archive-map

Additional information about Newsjunkie’s research and journalism resources can be found at https://www.newsjunkie.net/.

About Newsjunkie:

Newsjunkie.net is an independent journalism resource and database operating under the mission “Who’s behind the News?” The site tracks news organizations, media ownership networks, funding sources, broadcasts, journalism schools, and the key people behind media. It’s a free site, without advertising or a paywall. Its Prairie Fire project covers the data-rescue movement, tracking government erasures of public scientific records, and the organizations working to preserve them. Newsjunkie.net is published by Dharma Road, Inc., Los Angeles.

Media Only Contact:
Peter Landau / Newsjunkie.net
(424) 256-2902
peter@newsjunkie.net

MULTIMEDIA

Image link for media: https://www.Send2Press.com/300dpi/26-0317-s2p-njmapping-300dpi.webp

Image caption: Interactive mapping tool from Guide to Public Archives © Newsjunkie.net

NEWS SOURCE: Newsjunkie


This press release was issued on behalf of the news source (Newsjunkie), who is solely responsible for its accuracy, by Send2Press Newswire. Image, if any, was provided by the news source and not this website or the wire service. Information is believed accurate, as provided by the news source, but is not guaranteed.

To view the original story, visit: https://www.send2press.com/wire/archive-directory-unlocks-secrets-of-worlds-knowledge-repositories/

Copr. © 2026 Send2Press® Newswire, Calif., USA. -- REF: S2P STORY ID: S2P133968 NOREL-3B


Archive directory unlocks secrets of world’s knowledge repositories

The Guide to Public Archives II is a unique navigational tool ideal for researchers looking for a comprehensive directory to the documents and artifacts of history

LOS ANGELES, Calif., March 17, 2026 (SEND2PRESS NEWSWIRE) — For the first time, journalists and researchers have a searchable directory of over 1,500 of the world’s knowledge repositories. The new publication is from Newsjunkie.net, the data-journalism resource known for its “Who’s Behind the News” reporting. Guide to Public Archives II, a fully revised and expanded directory of the world’s artifact and document repositories, is designed to help journalists and scholars quickly and easily locate essential research materials.

Interactive mapping tool from Guide to Public Archives © Newsjunkie.net
Image caption: Interactive mapping tool from Guide to Public Archives © Newsjunkie.net.

The updated guide now includes a full representation of essential archives from major institutions such as the Library of Congress and the Vatican Apostolic Archive to regional and specialized collections devoted to particular communities, disciplines, and eras, such as the Timorese Resistance Archive. Each entry has been significantly expanded, with richer descriptions, improved structure, and more detailed information on collections, access policies, and contact points.

The Guide to Public Archives II has never been more necessary. It arrives at a moment of heightened urgency around the preservation of public records. As federal agencies remove datasets, government websites are compromised by misinformation, and historical records whitewashed, archivists, researchers, and journalists need a destination untarnished by ideology. The Guide to Public Archives II is a permanent, free reference to the world’s institutions that hold the record of human activity not altered by prejudice or partisanship.

“In the 20th century, the world put its history into archives, libraries, and museums. In the 21st, the collections are being fully digitized, and while this benefits researchers immensely, information on collections is hard to find,” said Gordon Whiting, publisher of Newsjunkie. “The Guide to Public Archives solves that problem. For example, a journalist researching colonial-era Indonesia can see a description of the collections held at the Nationaal Archief in The Netherlands, which hold exactly the records they need, and how to access them.”

Whiting added, “Institutional archives preserve everything from ancient census records and scientific observations to modern newspapers, photographs, and government documents. Our goal was to develop a navigation tool that allows these wonderful materials to be easily found.”

Newsjunkie’s Guide to Public Archives II helps match researchers to specialized repositories that serve not just as custodians of historical materials, but as active centers of documentation, interpretation, and collaboration. Many archives also function as applied research centers. India’s Archives and Research Centre for Ethnomusicology, in Gurugram, produces original field documentation on regional forms of folk music, in addition to managing a collection of historic recordings.

Contributor Dr. Amy Catlin-Jairazbhoy of UCLA notes, “It’s a collaborative educational institution working with local and foreign scholars. I find it very unusual. It’s an applied approach to archiving.”

Future updates will add new search and filtering tools. “The scale of these collections can be overwhelming,” Whiting added. “But they’re critically important. These collections belong to everyone. We’re making every archive discoverable.”

The Guide to Public Archives II is available free of charge at https://www.newsjunkie.net/article/introducing-guide-to-public-archives

The interactive Global Archive Map is at https://www.newsjunkie.net/archive-map

Additional information about Newsjunkie’s research and journalism resources can be found at https://www.newsjunkie.net/.

About Newsjunkie:

Newsjunkie.net is an independent journalism resource and database operating under the mission “Who’s behind the News?” The site tracks news organizations, media ownership networks, funding sources, broadcasts, journalism schools, and the key people behind media. It’s a free site, without advertising or a paywall. Its Prairie Fire project covers the data-rescue movement, tracking government erasures of public scientific records, and the organizations working to preserve them. Newsjunkie.net is published by Dharma Road, Inc., Los Angeles.

Media Only Contact:
Peter Landau / Newsjunkie.net
(424) 256-2902
peter@newsjunkie.net

MULTIMEDIA

Image link for media: https://www.Send2Press.com/300dpi/26-0317-s2p-njmapping-300dpi.webp

Image caption: Interactive mapping tool from Guide to Public Archives © Newsjunkie.net

NEWS SOURCE: Newsjunkie


This press release was issued on behalf of the news source (Newsjunkie), who is solely responsible for its accuracy, by Send2Press Newswire. Image, if any, was provided by the news source and not this website or the wire service. Information is believed accurate, as provided by the news source, but is not guaranteed.

To view the original story, visit: https://www.send2press.com/wire/archive-directory-unlocks-secrets-of-worlds-knowledge-repositories/

Copr. © 2026 Send2Press® Newswire, Calif., USA. -- REF: S2P STORY ID: S2P133968 NOREL-3B


Food and Beverage Industry Posts Modest Growth with 50 New Planned Industrial Projects in February 2026

Current research identified 50 new projects in the Food and Beverage sector during February, a slight increase from 48 projects reported in January.

JACKSONVILLE BEACH, Fla., March 12, 2026 (SEND2PRESS NEWSWIRE) — Industrial SalesLeads announced today the February 2026 results of its new planned capital project spending report for the Food and Beverage industry. The Firm tracks planned industrial capital project activity across North America, including facility expansions, new plant construction, and major equipment modernization initiatives. Current research identified 50 new projects in the Food and Beverage sector during February, a slight increase from 48 projects reported in January.

Food and Beverage Industry Posts Modest Growth with 50 New Planned Industrial Projects in February 2026
Image caption: Food and Beverage Industry Posts Modest Growth with 50 New Planned Industrial Projects in February 2026.

The following are selected highlights on new Food and Beverage industry construction news.

Food and Beverage Project Type

  • Processing Facilities – 36 New Projects
  • Distribution and Industrial Warehouse – 17 New Projects

Food and Beverage Project Scope/Activity

  • New Construction – 12 New Projects
  • Expansion – 14 New Projects
  • Renovations/Equipment Upgrades – 22 New Projects
  • Plant Closing – 7 New Projects

Food and Beverage Project Location (Top 10 States)

  • California – 6
  • New York – 6
  • Massachusetts – 5
  • Virginia – 4
  • Ohio – 3
  • Wisconsin – 3
  • Illinois – 2
  • Indiana – 2
  • Michigan – 2
  • New Jersey – 2

LARGEST PLANNED PROJECT

During the month of February, our research team identified 4 new Food and Beverage facility construction projects with an estimated value of $100 million or more.

The largest project is owned by Smithfield Foods, Inc., who is planning to invest $1 billion for the construction of a processing facility in SIOUX FALLS, SD. They are currently seeking approval for the project. They will relocate their operations upon completion in late 2028.

TOP 10 TRACKED FOOD AND BEVERAGE PROJECTS

UTAH:

Dairy product mfr. is planning to invest $165 million for the expansion and equipment upgrades on their processing facility in LOGAN, UT. They are currently seeking approval for the project.

ARKANSAS:

Food products mfr. is planning to invest $105 million for the construction of a 175,000 sf processing facility in JONESBORO, AR. They are currently seeking approval for the project.

FLORIDA:

Animal feed mfr. is planning to invest $35 million for the construction of a 57,000 sf processing facility in MADISON, FL. They have recently received approval for the project.

DELAWARE:

Foodservice redistributor is planning to invest $33 million for the expansion of their distribution center in BEAR, DE by 150,000 sf. Construction is expected to start in Spring 2026, with completion slated for Summer 2027.

ALABAMA:

Food product mfr. is planning to invest $27 million for the renovation and equipment upgrades on their processing facility in MCCALLA, AL. They have recently received approval for the project.

TEXAS:

Food processing company is planning to invest $26 million for the construction of a 50,000 sf warehouse and processing facility at 3289 Eberhardt Rd. in TEMPLE, TX. They are currently seeking approval for the project. Completion is slated for Summer 2027.

OHIO:

Global retail chain is planning for the renovations and equipment upgrades on a recently acquired 1.8 million sf distribution center at 760 Encore Drive at TURTLECREEK TOWNSHIP, OH. They are currently seeking approval for the project.

MISSOURI:

Farm, ranch, and home store retailer is planning for a 465,000 sf expansion and equipment upgrades on their distribution center in LEES SUMMIT, MO. They are currently seeking approval for the project.

KANSAS:

Food product mfr. is planning to invest $21 million for the expansion and equipment upgrades on their processing facility in TOPEKA, KS. They are currently seeking approval for the project.

ILLINOIS:

Food products mfr. is planning for the construction of a 140,000 sf processing facility in WINFIELD, IL. They are currently seeking approval for the project. Construction is expected to start in early Spring 2026, with completion slated for Spring 2027.

ABOUT INDUSTRIAL SALESLEADS, INC.

Since 1959, Industrial SalesLeads, based in Jacksonville, FL is a leader in delivering industrial capital project intelligence and prospecting services for sales and marketing teams to ensure a predictable and scalable pipeline. Our Industrial Market Intelligence, IMI identifies timely insights on companies planning significant capital investments such as new construction, expansion, relocation, equipment modernization and plant closings in industrial facilities. The Outsourced Prospecting Services, an extension to your sales team, is designed to drive growth with qualified meetings and appointments for your internal sales team. Visit us at https://salesleadsinc.com.

Each month, our team provides hundreds of industrial reports within a variety of industries, including:

LEARN MORE:

https://www.salesleadsinc.com/industry/food-and-beverage/

https://www.salesleadsinc.com/data-solutions/industrial-project-reports/

BLOG: https://www.salesleadsinc.com/blog/

NEWS SOURCE: Industrial SalesLeads Inc


This press release was issued on behalf of the news source (Industrial SalesLeads Inc), who is solely responsible for its accuracy, by Send2Press Newswire. Image, if any, was provided by the news source and not this website or the wire service. Information is believed accurate, as provided by the news source, but is not guaranteed.

To view the original story, visit: https://www.send2press.com/wire/food-and-beverage-industry-posts-modest-growth-with-50-new-planned-industrial-projects-in-february-2026/

Copr. © 2026 Send2Press® Newswire, Calif., USA. -- REF: S2P STORY ID: S2P133830 NOREL-3B


Optimal Blue report: Purchase demand rebounds as mortgage market finds balance

Lock volume rises 9% month over month and nearly 40% year over year as lower rates draw borrowers back into the market

PLANO, Texas, March 10, 2026 (SEND2PRESS NEWSWIRE) — Optimal Blue today released its February 2026 Market Advantage mortgage data report, showing a meaningful improvement in lock activity as lower mortgage rates helped bring purchase borrowers back into the market. Total rate-lock volume rose 9% month over month (MoM) and was nearly 40% higher year over year (YoY). Purchase lock volume increased more than 14% from January and 5% compared with February 2025, driving refinance share down to 41% of locks from 44% in January. Rate-and-term and cash-out refinance activity edged modestly higher from January but remained sharply stronger YoY.

Optimal Blue’s February 2026 Market Advantage mortgage data report
Image caption: Optimal Blue’s February 2026 Market Advantage mortgage data report.

Mortgage rates declined across all major products in February. The OBMMI 30-year conforming fixed rate, the benchmark for CME Group’s Mortgage Rate futures, finished the month at 5.90%, down 17 basis points (bps) from January. Jumbo and VA rates each declined 11 bps during the month, while FHA rates fell 13 bps. The 10-year Treasury yield closed the month at 3.97%, down nearly 30 bps, and the spread between the 10-year Treasury and the OBMMI 30-year rate widened to 193 bps as the mortgage rally lagged the broader bond market.

“February’s data shows the market settling into a healthier balance between purchase and refinance activity as rates moved lower,” said Mike Vough, senior vice president of corporate strategy at Optimal Blue. “Purchase demand is back after a slow start to the year, but refinance share is still running at 41%, which is higher than anything we saw between early 2022 and late last year.”

Secondary market data in February pointed to shifting execution dynamics as pricing spreads widened and delivery strategies evolved. Best-efforts-to-mandatory spreads widened for conventional products while hedged loan sales moved toward the agency cash window. At the same time, agency mortgage-backed securities (MBS) securitization declined and mortgage servicing rights (MSR) values increased despite falling benchmark rates.

“In an environment like this, lenders are paying close attention to how they execute and manage risk,” said Vough. “We’re seeing more active positioning across delivery channels and servicing assets as lenders balance near-term pricing with longer-term portfolio value.”

Key findings from the Market Advantage report, derived from direct-source mortgage lock and secondary market data, include:

Volume trends and market composition

  • Refinance activity remains strong: Refinances accounted for 41% of total lock volume in February, down from 44% in January, as purchase demand rebounded. Rate-and-term refinance locks increased 3% MoM and 280% YoY, while cash-out refinance volume rose 1% MoM and 34% YoY.
  • Purchase demand rebounds: Purchase lock volume rose 14% MoM and 5% YoY, marking a meaningful improvement from January’s slower start to the year and helping restore a more balanced mix between purchase and refinance activity.
  • Non-conforming share expands: Conforming loans represented 53% of total lock volume in February, down 28 bps MoM but up 62 bps YoY. Non-conforming share increased to 16%, rising 91 bps MoM and 90 bps YoY. FHA loans accounted for 17% of locks, VA loans for 13% and USDA loans for 1%.
  • ARM utilization rises: Adjustable-rate mortgages comprised 10% of total lock volume in February, up 111 bps MoM and 337 bps YoY from 6.9% last year.

Rates and pricing

  • Rates move lower: The OBMMI 30-year conforming fixed rate declined 17 bps to 5.90%. Jumbo and VA rates each fell 11 bps, while FHA rates declined 13 bps. The 10-year Treasury yield declined nearly 30 bps to 3.97%, while the mortgage-to-Treasury spread widened to 193 bps.
  • MSR values increase: Mortgage servicing rights for conforming 30-year loans rose 2 bps to 1.18%, representing a 4.74 multiple, even as benchmark mortgage rates declined during the month.
  • Spreads adjust across products: Best-efforts-to-mandatory spreads widened for conventional products, with the conforming 30-year spread increasing 3 bps and the conventional 15-year spread rising 1 bp. The government 30-year spread decreased 5 bps.
  • Loan pricing mix shifts slightly: The share of loans sold at the highest price tier declined 100 bps to 78%, while second-tier executions increased 100 bps to 13%.

Channel and execution

  • Securitization share pulls back: Agency MBS securitizations accounted for 42% of hedged executions in February, down from 47% in January.
  • Cash window share jumps: Hedged loan sales to the agency cash window rose 500 bps MoM to 29%, the largest share of cash window deliveries since February 2025.

Product mix and borrower profiles

  • Credit profiles diverge: Purchase FICO scores averaged 734 in February, down 1 point MoM and 3 points YoY. Refinance credit profiles strengthened, with cash-out scores averaging 705 (up 1 point MoM and 10 points YoY) and rate-and-term scores averaging 749 (up 2 points MoM and 18 points YoY).
  • Loan amounts climb: The national average loan amount increased from $400,667 in January to $404,586 in February, marking the first time the average has remained above $400,000 for consecutive months. The national average loan-to-value ratio was 80.32%. Loan amounts ranged from $875,787 in the San Francisco Bay area to $319,743 in San Antonio, with regional LTVs spanning from 68.45% in the Bay area to 89.38% in San Antonio.

To view the full February 2026 Market Advantage report, complete the free subscription form: https://engage.optimalblue.com/market-advantage.

Subscribers receive a report PDF each month with the latest data. Members of the press are eligible for special, advance access each month and should contact Leslie Colley to be added to the media list.

About the Market Advantage Report

Optimal Blue issues the Market Advantage mortgage report each month to provide insight into U.S. mortgage trends and drivers of lending profitability. Data is sourced from the Optimal Blue PPE, which is used to price and lock more than one-third of all mortgages nationwide, and Optimal Blue’s hedging and loan trading system, which supports approximately 40% of loans hedged and sold into the secondary market. As the leader in mortgage capital markets technology, Optimal Blue has a direct view of both origination and secondary market activity and the interconnectedness of the two. Unlike self-reported survey data, Optimal Blue’s direct-source data accurately reflect the in-process loans in lenders’ pipelines and secondary market executions. Visit Optimal Blue’s website to subscribe to receive the free report each month.

Nothing herein shall be construed as, nor is Optimal Blue providing, any legal, trading, hedging or financial advice.

About Optimal Blue

Optimal Blue powers profitability across the mortgage capital markets ecosystem. As the industry’s only end-to-end capital markets platform, our technology, data and integrations bridge the primary and secondary markets to help lenders of all sizes maximize performance – from pricing accuracy to margin protection and every step in between. Backed by over 20 years of proven expertise, our modern, cloud-native technology delivers the real-time automation, actionable data and seamless connectivity lenders need to navigate market volatility and scale for growth. To learn more about how Optimal Blue delivers measurable ROI, visit OptimalBlue.com.

MULTIMEDIA

Image link for media: https://www.Send2Press.com/300dpi/26-0310-s2p-opblufeb26mk-300dpi.webp

Image caption: Optimal Blue’s February 2026 Market Advantage mortgage data report.

NEWS SOURCE: Optimal Blue


This press release was issued on behalf of the news source (Optimal Blue), who is solely responsible for its accuracy, by Send2Press Newswire. Image, if any, was provided by the news source and not this website or the wire service. Information is believed accurate, as provided by the news source, but is not guaranteed.

To view the original story, visit: https://www.send2press.com/wire/optimal-blue-report-purchase-demand-rebounds-as-mortgage-market-finds-balance/

Copr. © 2026 Send2Press® Newswire, Calif., USA. -- REF: S2P STORY ID: S2P133788 NOREL-3B