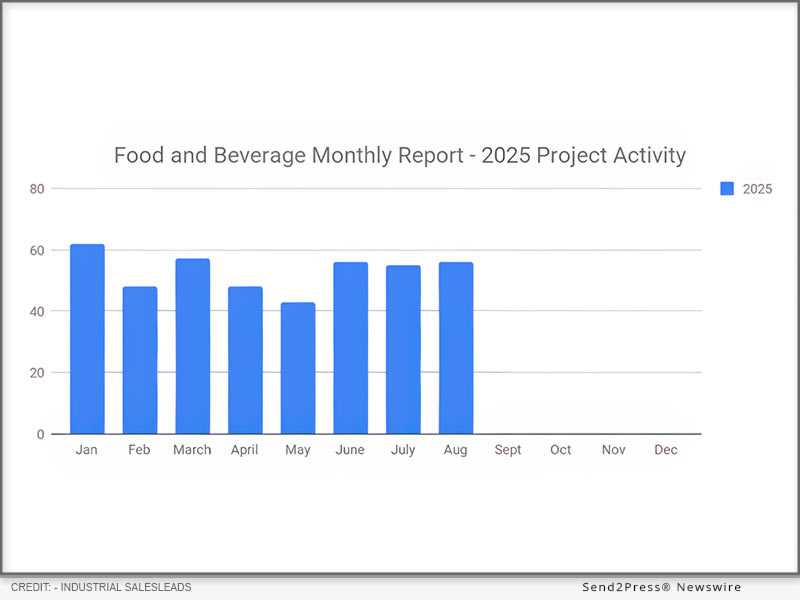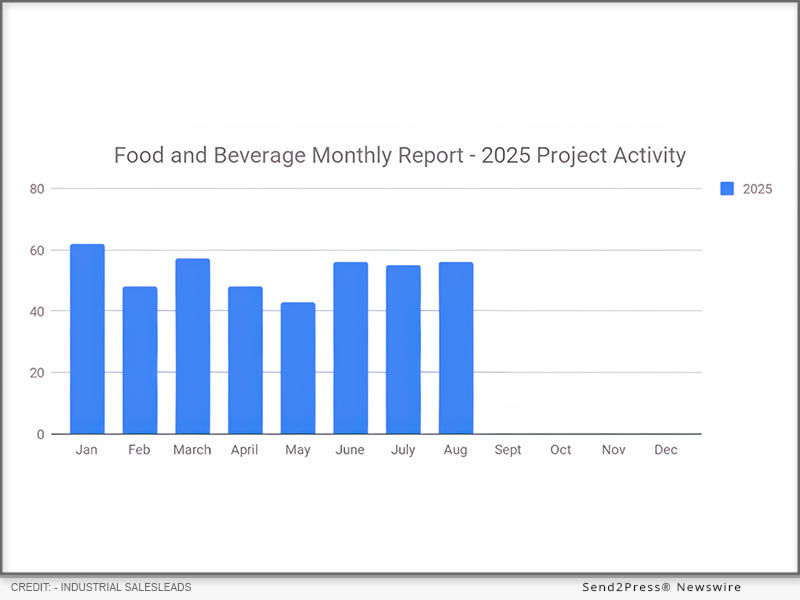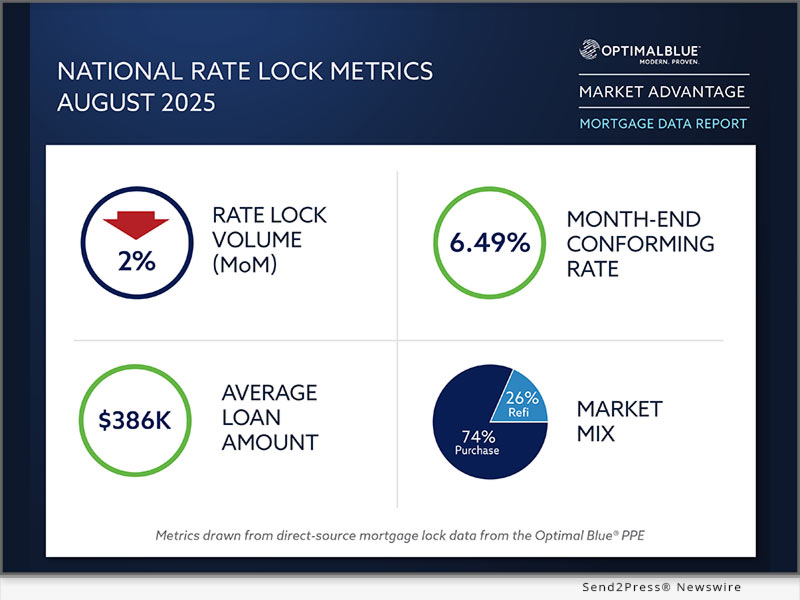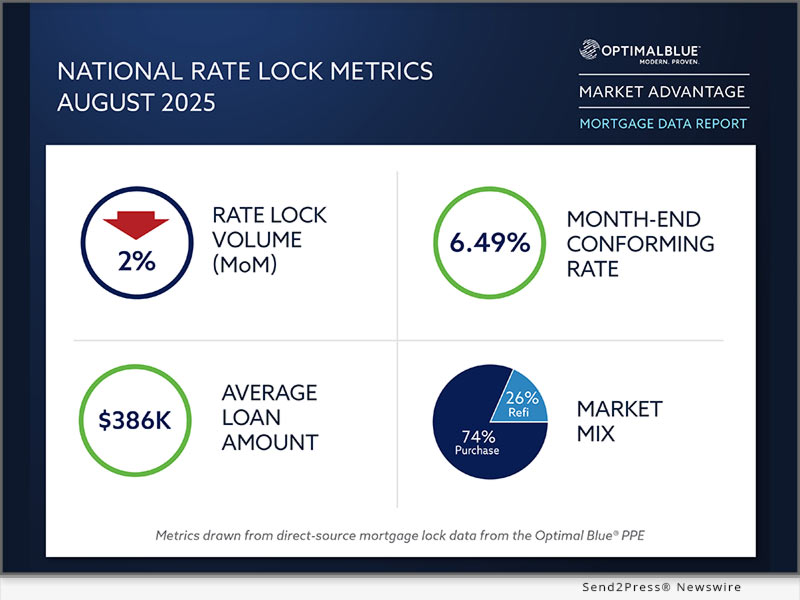
Tag Archives: Reports and Studies

Renovations and Equipment Upgrades Fell 18% in February 2026; Other Capital Projects Remain Stable

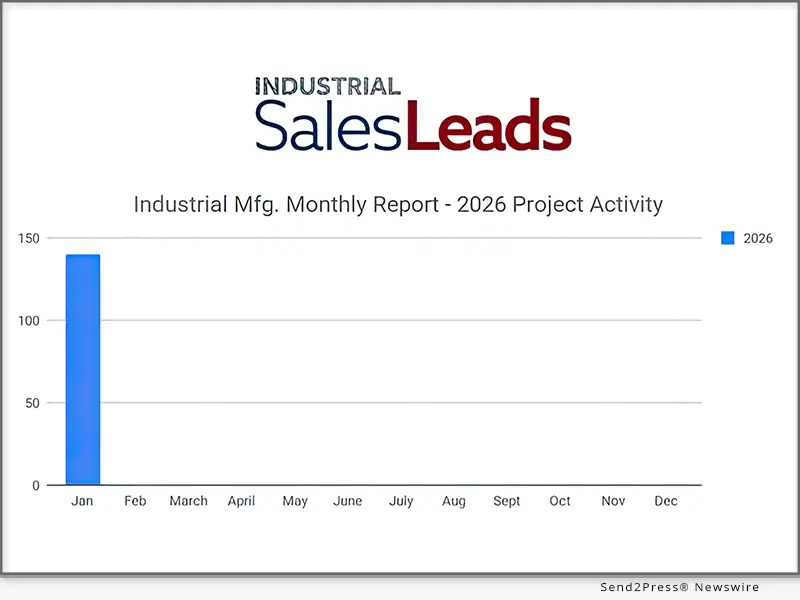
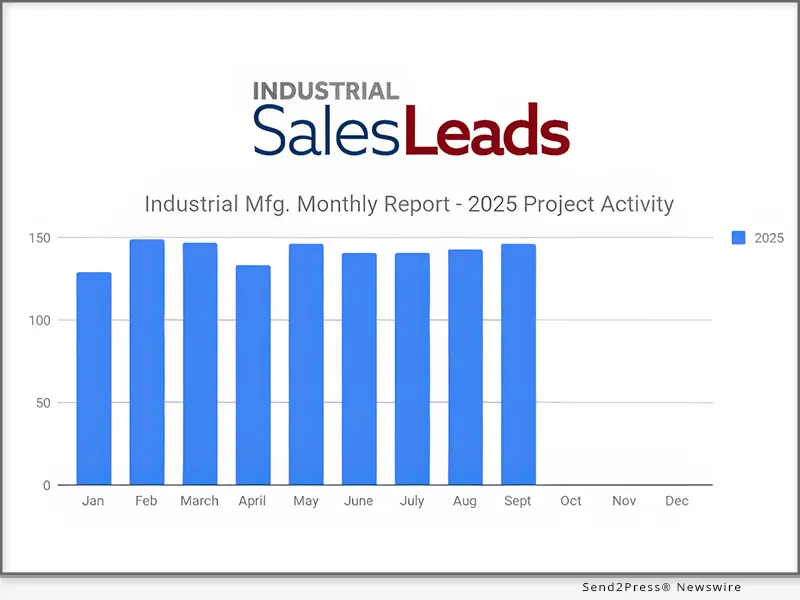
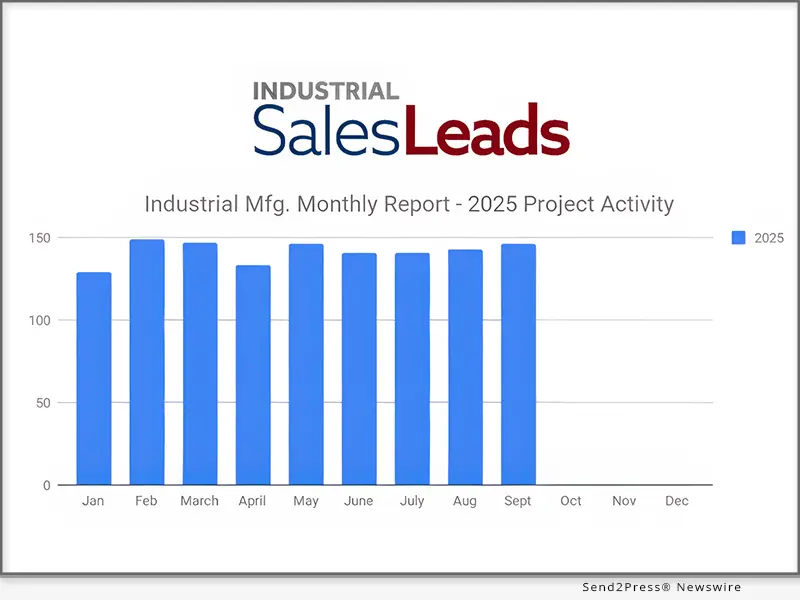
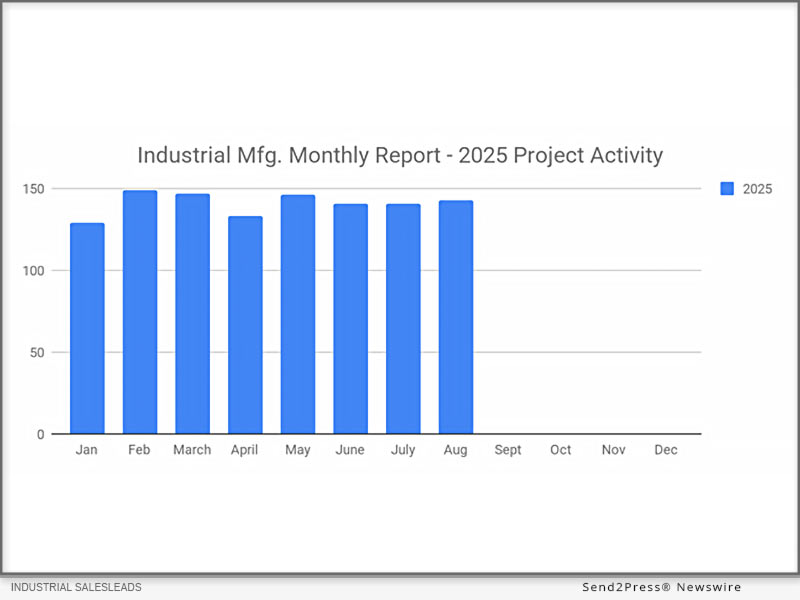
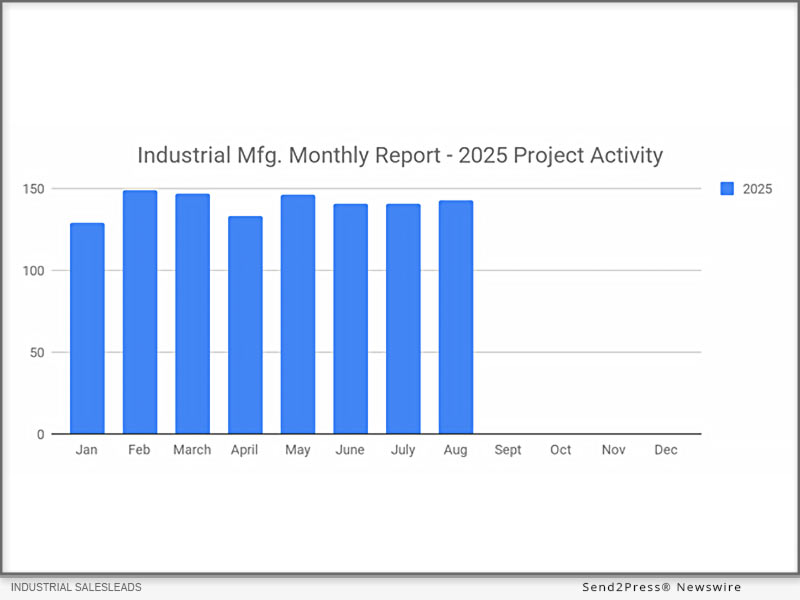
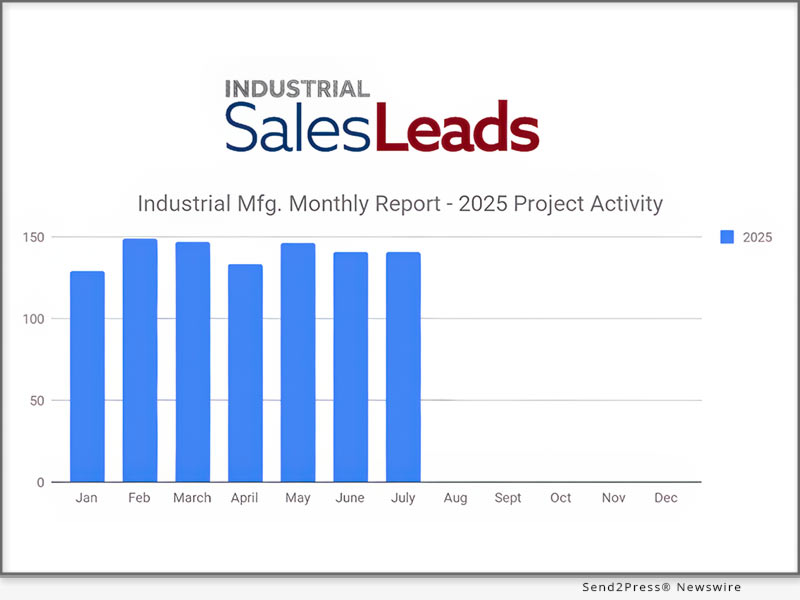
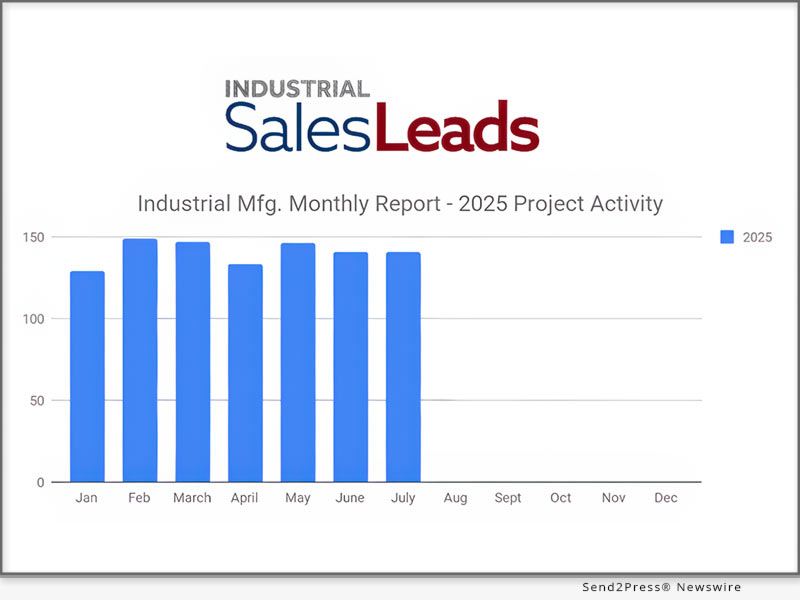
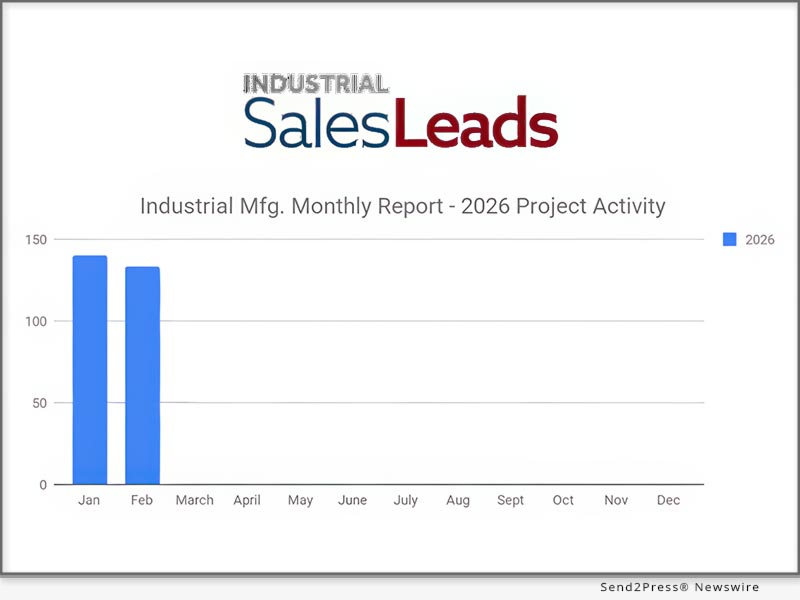
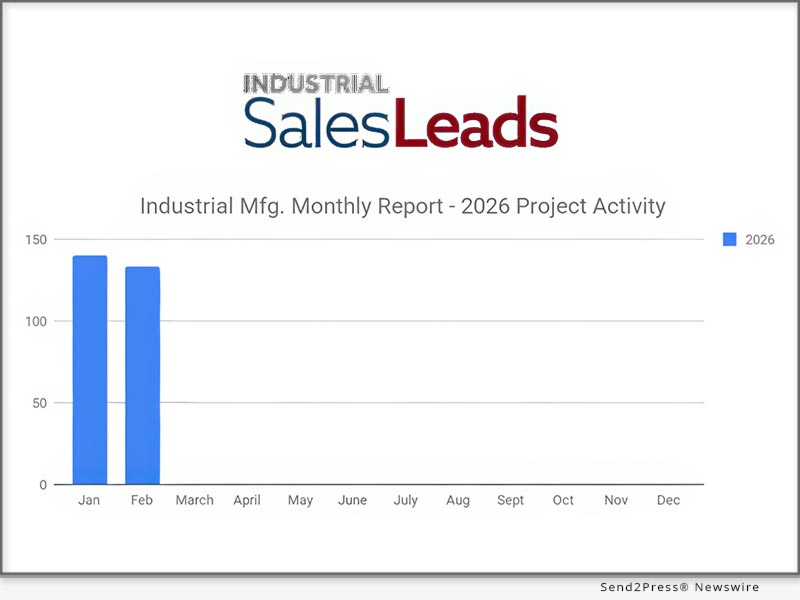
February research identified 133 new Industrial Manufacturing projects, representing a 5% month-over-month decline from 140 projects recorded in January

JACKSONVILLE BEACH, Fla., March 5, 2026 (SEND2PRESS NEWSWIRE) — Industrial SalesLeads released its February 2026 Planned Capital Project Spending Report for the Industrial Manufacturing sector. The firm tracks industrial capital investment activity across North America, including facility expansions, new plant construction, and significant equipment modernization projects.
Renovations and Equipment Upgrades Fell 18% in February 2026; Other Capital Projects Remain Stable
Renovations and Equipment Upgrades Fell 18% in February 2026; Other Capital Projects Remain Stable.

February research identified 133 new Industrial Manufacturing projects, representing a 5% month-over-month decline from 140 projects recorded in January. All other tracked capital project categories remained stable, indicating a modest pullback in planned activity rather than a broad contraction in industrial investment.

The following are selected highlights on new Industrial Manufacturing industry construction news.

INDUSTRIAL MANUFACTURING – BY PROJECT TYPE

  • Manufacturing/Production Facilities – 117 New Projects
  • Distribution and Industrial Warehouse – 66 New Projects

INDUSTRIAL MANUFACTURING – BY PROJECT SCOPE/ACTIVITY

  • New Construction – 32 New Projects
  • Expansion – 48 New Projects
  • Renovations/Equipment Upgrades – 62 New Projects
  • Plant Closings – 13 New Projects

INDUSTRIAL MANUFACTURING – BY PROJECT LOCATION (TOP 10 STATES)

  • New York – 10
  • Massachusetts – 9
  • North Carolina – 8
  • Texas – 8
  • Tennessee – 7
  • California – 6
  • Florida – 6
  • Georgia – 6
  • Iowa – 6
  • Indiana – 6
  • Pennsylvania – 6

LARGEST PLANNED PROJECT

During the month of February, our research team identified 19 new Industrial Manufacturing facility construction projects with an estimated value of $100 million or more.

The largest project is owned by Eli Lilly and Company, who is planning to invest $4 billion for the construction of a 925,000 sf processing campus at 9802 Main St. in FOGELSVILLE, PA. They are currently seeking approval for the project, with completion slated for 2031.

TOP 10 TRACKED INDUSTRIAL MANUFACTURING PROJECTS

PENNSYLVANIA:

Pharmaceutical company is planning to invest $1 billion for the construction of a processing facility in LOWER GWYNEDD TWP., PA. They are currently seeking approval for the project.

INDIANA:

Steel company is planning to invest $900 million for the expansion and equipment upgrades on their manufacturing facility in GARY, IN. They are currently seeking approval for the project.

VIRGINIA:

Aerospace component mfr. is planning to invest $500 million for the construction of an 860,000 sf manufacturing facility in HURT, VA. They have recently received approval for the project.

NORTH CAROLINA:

Energy infrastructure equipment mfr. is planning to invest $421 million for an expansion of their manufacturing facilities in CHARLOTTE, NC, RURAL HALL, NC and RALEIGH, NC. They are currently seeking approval for the project.

NEW YORK:

Textile waste regeneration company is planning to invest $390 million for the construction of a 145,000 sf processing facility in ROCHESTER, NY. They are currently seeking approval for the project. Completion is slated for late 2029.

ILLINOIS:

Pharmaceutical company is planning to invest $380 million for the construction of two processing facilities on their campus in NORTH CHICAGO, IL. Construction is expected to start in Spring 2026, with completion slated for 2029.

MISSISSIPPI:

Energy infrastructure equipment mfr. is planning to invest $300 million for the construction of a manufacturing facility in PEARL, MS. They are currently seeking approval for the project.

FLORIDA:

Defense shipbuilder is planning to invest $275 million for the construction of a 400,000 sf manufacturing facility in PENSACOLA, FL. They have recently received approval for the project. Completion is slated for Fall 2027.

NORTH CAROLINA:

Fiber optic cable mfr. is planning to invest $268 million for an expansion of their manufacturing facility in HICKORY, NC. They are currently seeking approval for the project.

WISCONSIN:

Power tool mfr. is planning to invest $206 million for the construction of a 750,000 sf manufacturing and warehouse facility on Good Hope Rd. in MENOMONEE FALLS, WI. The project includes the renovation of a 164,000 sf research and laboratory facility at the site. They are currently seeking approval for the project.

ABOUT INDUSTRIAL SALESLEADS, INC.

Since 1959, Industrial SalesLeads, based in Jacksonville, FL is a leader in delivering industrial capital project intelligence and prospecting services for sales and marketing teams to ensure a predictable and scalable pipeline. Our Industrial Market Intelligence, IMI identifies timely insights on companies planning significant capital investments such as new construction, expansion, relocation, equipment modernization and plant closings in industrial facilities. The Outsourced Prospecting Services, an extension to your sales team, is designed to drive growth with qualified meetings and appointments for your internal sales team. Visit us at https://salesleadsinc.com/.

Each month, our team provides hundreds of industrial reports within a variety of industries, including:

More information: https://www.salesleadsinc.com/industry/industrial-manufacturing/

BLOG: https://www.salesleadsinc.com/blog/

NEWS SOURCE: Industrial SalesLeads Inc


This press release was issued on behalf of the news source (Industrial SalesLeads Inc), who is solely responsible for its accuracy, by Send2Press Newswire. Image, if any, was provided by the news source and not this website or the wire service. Information is believed accurate, as provided by the news source, but is not guaranteed.

To view the original story, visit: https://www.send2press.com/wire/renovations-and-equipment-upgrades-fell-18-in-february-2026-other-capital-projects-remain-stable/

Copr. © 2026 Send2Press® Newswire, Calif., USA. -- REF: S2P STORY ID: S2P133709 NOREL-3B
 

ACES Q3 2025 Mortgage QC Industry Trends Report shows concentrated rise in critical defects as income and compliance findings increase

DENVER, Colo., Feb. 18, 2026 (SEND2PRESS NEWSWIRE) — ACES Quality Management® (ACES), the leading provider of enterprise quality management and control software for the financial services industry, today announced the release of its quarterly ACES Mortgage QC Industry Trends Report covering Q3 2025. The report analyzes post-closing quality control data derived from the ACES Quality Management & Control® software.

ACES Quality Management
Image caption: ACES Quality Management.

Key findings from the Q3 2025 ACES Mortgage QC Industry Trends Report include:

  • The overall critical defect rate increased 18.5%, rising from 1.51% in Q2 2025 to 1.79% in Q3 2025.
  • Income/Employment defects increased 47.6%, rising from 18.45% to 27.24% of all critical defects and remaining the largest defect category.
  • Legal/Regulatory/Compliance defects increased 16.8%, rising from 16.24% to 18.97%.
  • Borrower/Mortgage Eligibility defects decreased 56.5%, declining from 15.87% to 6.90%.
  • Purchase defect share decreased to 62.65%, while refinance defect share increased to 37.35% as refinance review share expanded.
  • Conventional loans accounted for 57.18% of all critical defects, FHA for 31.10% and VA for 11.00%, reflecting relative stability across products with modest shifts in defect concentration.

“While the overall critical defect rate increased again in Q3 2025, the underlying data points to a market adjusting to a shifting mix rather than a broad decline in manufacturing quality,” said Nick Volpe, executive vice president of ACES Quality Management. “The increase was driven primarily by concentrated deterioration in income- and compliance-related findings, reinforcing the importance of documentation integrity and disciplined validation as refinance activity expands and lenders continue to operate lean.”

Findings for the Q3 2025 ACES Mortgage QC Industry Trends Report are based on post-closing quality control data derived from the ACES Quality Management and Control® benchmarking system and incorporate data from prior quarters, where applicable. All reviews and defect data evaluated for the report were based on loan audits selected by lenders for full file reviews. The Mortgage QC Industry Trends Reports are available for download, free of charge, at https://www.acesquality.com/resources/reports.

About ACES Quality Management

ACES Quality Management is the leading provider of enterprise quality management and control software for the financial services industry. The nation’s most prominent lenders, servicers and financial institutions rely on ACES Quality Management & Control® Software to improve audit throughput and quality while controlling costs, including:

  • Over 70% of the top 20 independent mortgage lenders;
  • 7 of the top 10 loan servicers;
  • 11 of the top 30 banks; and
  • 3 of the top 5 credit unions in the United States.

Unlike other quality control platforms, ACES Flexible Audit Technology® enables independent mortgage lenders and financial institutions to easily manage and customize the system to their specific needs without relying on IT or outside resources. With ACES’ AI-powered capabilities, audit teams can translate complexity into clear insights and accelerate performance.

Using a customer-centric approach, ACES clients get responsive support and access to our experts to maximize their investment. For more information, visit https://www.acesquality.com/ or call 1-800-858-1598.

LOGO link for media: https://www.acesquality.com/assets/images/aces-logo.svg

NEWS SOURCE: ACES Quality Management


This press release was issued on behalf of the news source (ACES Quality Management), who is solely responsible for its accuracy, by Send2Press Newswire. Image, if any, was provided by the news source and not this website or the wire service. Information is believed accurate, as provided by the news source, but is not guaranteed.

To view the original story, visit: https://www.send2press.com/wire/aces-q3-2025-mortgage-qc-industry-trends-report-shows-concentrated-rise-in-critical-defects-as-income-and-compliance-findings-increase/

Copr. © 2026 Send2Press® Newswire, Calif., USA. -- REF: S2P STORY ID: S2P133256 NOREL-3B


Tratta Releases 2026 Reality Check Debt Collection Industry Report

New benchmark identifies a widening gap between ambition and maturity as poor integration caps performance and scalability

BRAINERD, Minn., Feb. 18, 2026 (SEND2PRESS NEWSWIRE) — Tratta announces the release of “The 2026 Reality Check: The Widening Gap Between Digital Ambition and Maturity,” a new industry survey report examining how debt collection agencies, legal recovery firms, and original creditors are progressing in their digital transformation efforts.

Tratta Releases 2026 Reality Check Debt Collection Industry Report
Image caption: Tratta Releases 2026 Reality Check Debt Collection Industry Report.

Based on a survey of 74 industry leaders and practitioners, the report finds that digital progress in the debt collection industry is not limited by a lack of tools, but by a lack of connection between them. The report identifies integration maturity as the defining gap separating organizations that can scale digital operations from those that remain stuck in early-stage adoption.

As tools continue to improve, organizations are heavily investing in digital channels and automation, yet execution remains uneven. Most organizations remain constrained by fragmented systems and delayed data, which limit performance, scalability, and measurement.

“Debt collection technology has made real progress in areas including compliance and governance,” says Tratta Founder and CEO Josh Allen, “but maturity doesn’t come from adding more tools. Our data shows that integration is the dividing line.” He continues, “Without connected systems and timely data, digital strategies can’t move beyond pilots or deliver the consistent results that agencies, recovery firms, and creditors need to scale.”

A MARKET STUCK IN THE MIDDLE

The report uses the Modern Collections Technology Index to assess digital maturity across four bands (Developing, Emerging, Scaling, and Leading). The MCTI is Tratta’s proprietary benchmarking framework that measures operational readiness across four domains: Agent Enablement, Compliance and Quality Assurance, Conversion Economics, and Data and Integration.

According to the report, the average industry MCTI score identifies much of the market firmly in the Developing maturity band. While more than one-third of respondents have reached Scaling or Leading levels of digital maturity, only 5.4% currently operate at a level of total modernization characterized by real-time integration, measurement, and continuous optimization.

One of the most striking findings highlights a structural imbalance across capabilities. Compliance and QA are the most mature domains, with more than half of organizations achieving Scaling or Leading levels. In contrast, the Data and Integration score is lowest, with nearly one-third of respondents still in the Emerging band. Compliance maturity outpaces integration maturity in almost half of the responses, underscoring the industry’s tendency to prioritize safeguards over infrastructure.

“This imbalance creates a performance ceiling,” Allen explains. “The least mature capability is the one that limits business growth. Modernization is a weakest-link problem. For most organizations in our industry today, that’s integration.”

FROM DIGITAL INTENT TO OPERATIONAL REALITY

The 2026 report also reveals a persistent gap between digital intent and execution. Despite widespread adoption of portals and digital payment tools, 54% of payments are still completed via live agent calls, indicating continued reliance on manual workflows. Agent visibility into consumer digital behavior remains limited, and decisioning is largely manual or rules-based, with fewer than 7% of organizations using advanced models or controlled testing.

Industry professionals themselves echo these findings in open-ended responses, consistently calling for better system connectivity, real-time data synchronization, and improved agent enablement rather than additional solutions.

“The data and practitioner feedback clearly align,” says Allen, “and it makes this study even more valuable. What we see is that leaders aren’t looking for more tools. What they need is for their existing tools to drive growth by working together.”

A PRACTICAL ROADMAP FOR THE FUTURE

Beyond the survey results, the report provides a sequenced action roadmap to help debt collection agencies, legal recovery firms, and original creditors move from fragmented digital adoption to connected operations and measurable results. The guidance emphasizes raising the floor in constraint areas such as integration and instrumentation before layering on advanced orchestration, personalization, and optimization.

“Our goal with this report is clarity,” Allen concludes. “When organizations understand where they truly stand and what’s holding them back, they can modernize with intent instead of guesswork.”

Designed as an inaugural benchmark, the 2026 Reality Check establishes a baseline for year-over-year tracking, with future editions planned to expand trend analysis and sector-specific insights.

The full report is available for download here:  https://landing.tratta.io/tratta-debt-collection-report

ABOUT TRATTA

Tratta is a modern, end-to-end debt collection and recovery platform built for agencies, law firms, and original creditors navigating today’s digital, compliance-driven environment.

Key capabilities include:

  • Fully branded, mobile-first self-service payment and collections portal
  • Granular configuration across workflows, legal language, settlement logic, and payment eligibility
  • Enterprise-grade security with PCI Level 1, SOC 2 Type 2, and ESIGN compliance
  • Multi-channel campaign engagement tools, including SMS, email, payment links, and QR code tracking
  • Real-time performance and compliance reporting for operational visibility

Built as a fully integrated system rather than bolt-on tools, Tratta helps organizations increase recovery rates, reduce manual effort, and deliver a compliant, consumer-friendly experience at scale.

Visit https://www.tratta.io/ for additional details and to schedule a convenient demo.

LOGO link for media: https://www.Send2Press.com/300dpi/26-0218-s2p-trattalogo-300dpi.webp

NEWS SOURCE: Tratta


This press release was issued on behalf of the news source (Tratta), who is solely responsible for its accuracy, by Send2Press Newswire. Image, if any, was provided by the news source and not this website or the wire service. Information is believed accurate, as provided by the news source, but is not guaranteed.

To view the original story, visit: https://www.send2press.com/wire/tratta-releases-2026-reality-check-debt-collection-industry-report/

Copr. © 2026 Send2Press® Newswire, Calif., USA. -- REF: S2P STORY ID: S2P133270 NOREL-3B


January 2026 Surges with a 22% Increase in New Industrial Projects Erasing December’s Decline of 20%

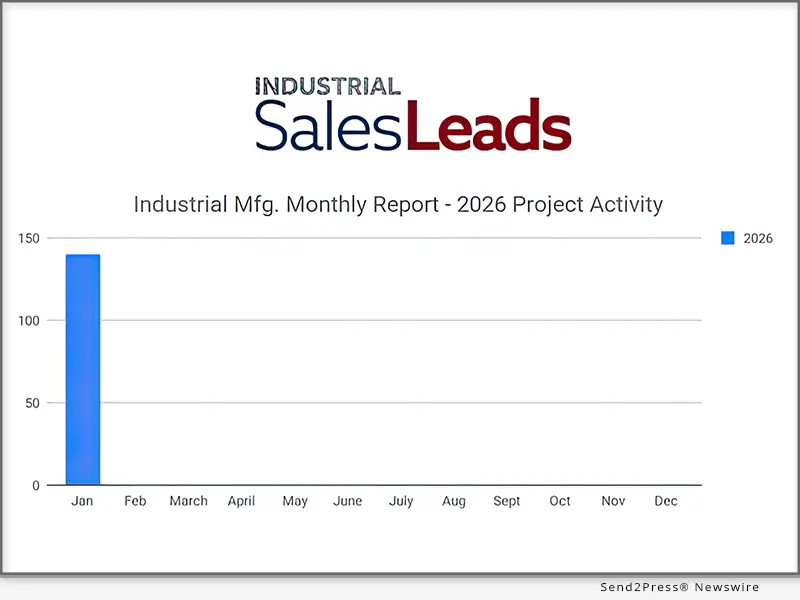
January research identified 140 new industrial manufacturing projects

JACKSONVILLE BEACH, Fla., Feb. 12, 2026 (SEND2PRESS NEWSWIRE) — Industrial SalesLeads released its January 2026 New Planned Capital Project Spending Report for the Industrial Manufacturing sector, highlighting a strong rebound in project activity. The Firm monitors planned industrial capital investments across North America, including plant expansions, new facility construction, and major equipment modernization initiatives.

January 2026 Surges with a 22% Increase in New Industrial Projects Erasing December’s Decline of 20%
Image caption: January 2026 Surges with a 22% Increase in New Industrial Projects Erasing December’s Decline of 20%.

January research identified 140 new industrial manufacturing projects, marking a significant increase that offsets December’s decline, the lowest level of planned project activity reported in 2025.

The following are selected highlights on new Industrial Manufacturing industry construction news.

INDUSTRIAL MANUFACTURING – BY PROJECT TYPE

  • Manufacturing/Production Facilities – 120 New Projects
  • Distribution and Industrial Warehouse – 72 New Projects

INDUSTRIAL MANUFACTURING – BY PROJECT SCOPE/ACTIVITY

  • New Construction – 29 New Projects
  • Expansion – 43 New Projects
  • Renovations/Equipment Upgrades – 76 New Projects
  • Plant Closings – 13 New Projects

INDUSTRIAL MANUFACTURING – BY PROJECT LOCATION (TOP 10 STATES)

  • Indiana – 14
  • Texas – 12
  • California – 11
  • Ohio – 9
  • Michigan – 8
  • New York – 8
  • North Carolina – 8
  • Wisconsin – 7
  • Mississippi – 6
  • Tennessee- 6
  • Alabama – 5

LARGEST PLANNED PROJECT

During the month of January, our research team identified 16 new Industrial Manufacturing facility construction projects with an estimated value of $100 million or more.

The largest project is owned by GlobalWafers America, who is planning to invest $4 billion for the expansion of their manufacturing facility in SHERMAN, TX. They are currently seeking approval for the project.

TOP 10 TRACKED INDUSTRIAL MANUFACTURING PROJECTS

TENNESSEE:

Laser technology company is planning to invest $1.4 billion for the construction of a processing facility in OAK RIDGE, TN. They are currently seeking approval for the project.

CALIFORNIA:

Aerospace company is planning to invest $1 billion for the construction of a 1 million sf manufacturing, research, and office campus in LONG BEACH, CA. They are currently seeking approval for the project.

ALABAMA:

Valve and pipe mfr. is planning to invest $793 million for the expansion and equipment upgrades on their manufacturing facility in BIRMINGHAM, AL. They are currently seeking approval for the project.

INDIANA:

Global life sciences company is planning to invest $435 million for the construction of a 500,000 sf processing, laboratory, and office facility in BROWNSBURG, IN. They are currently seeking approval for the project and will relocate their INDIANAPOLIS, IN operations upon completion in 2030.

TEXAS:

Semiconductor mfr. is planning to invest $223 million for the expansion and equipment upgrades on their manufacturing facility in ROUND ROCK, TX. They are currently seeking approval for the project.

INDIANA:

Battery component mfr. is planning to invest $200 million for the expansion and equipment upgrades on their processing facility at 3611 S. Adams St. in MARION, IN. They are currently seeking approval for the project.

TEXAS:

Electrical equipment mfr. is planning to invest $200 million for the construction of a 500,000 sf manufacturing facility in SAN ANTONIO, TX. They are currently seeking approval for the project.

UTAH:

Electrical equipment mfr. is planning to invest $168 million for the expansion and equipment upgrades on their manufacturing facility in ENOCH, UT. They are currently seeking approval for the project.

ALABAMA:

HVAC equipment mfr. is planning to invest $119 million for the renovation and equipment upgrades on a 460,000 sf manufacturing and warehouse facility at 7700 Gunters Way in HUNTSVILLE, AL. They are currently seeking approval for the project.

NEBRASKA:

Medical equipment mfr. is planning to invest $110 million for the expansion and equipment upgrades on their manufacturing facility in COLUMBUS, NE. They are currently seeking approval for the project.

ABOUT INDUSTRIAL SALESLEADS, INC.

Since 1959, Industrial SalesLeads, based in Jacksonville, FL is a leader in delivering industrial capital project intelligence and prospecting services for sales and marketing teams to ensure a predictable and scalable pipeline. Our Industrial Market Intelligence, IMI identifies timely insights on companies planning significant capital investments such as new construction, expansion, relocation, equipment modernization and plant closings in industrial facilities. The Outsourced Prospecting Services, an extension to your sales team, is designed to drive growth with qualified meetings and appointments for your internal sales team. Visit us at https://salesleadsinc.com/.

Each month, our team provides hundreds of industrial reports within a variety of industries, including:

Learn more: https://www.salesleadsinc.com/industry/industrial-manufacturing/

Blog: https://www.salesleadsinc.com/blog/

NEWS SOURCE: Industrial SalesLeads Inc


This press release was issued on behalf of the news source (Industrial SalesLeads Inc), who is solely responsible for its accuracy, by Send2Press Newswire. Image, if any, was provided by the news source and not this website or the wire service. Information is believed accurate, as provided by the news source, but is not guaranteed.

To view the original story, visit: https://www.send2press.com/wire/january-2026-surges-with-a-22-increase-in-new-industrial-projects-erasing-decembers-decline-of-20/

Copr. © 2026 Send2Press® Newswire, Calif., USA. -- REF: S2P STORY ID: S2P133125 NOREL-3B


New Food and Beverage Planned Projects Return to May 2025 Levels

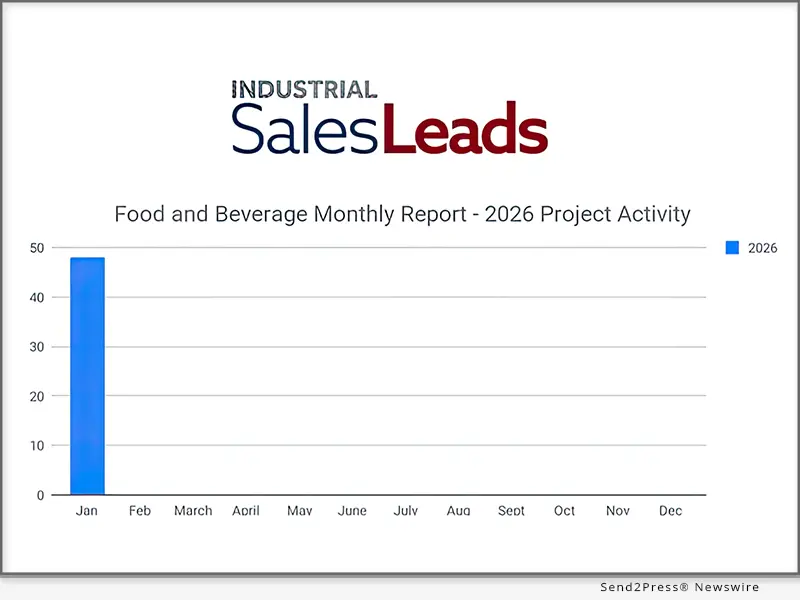
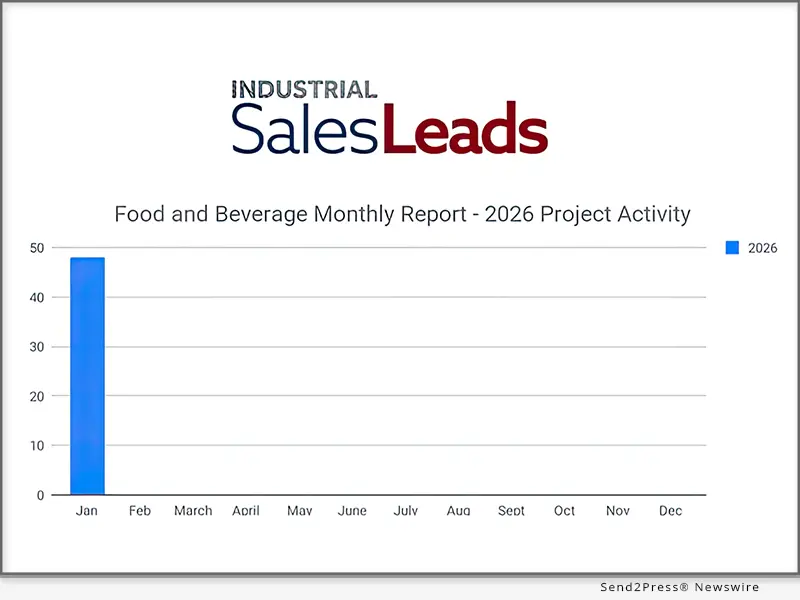
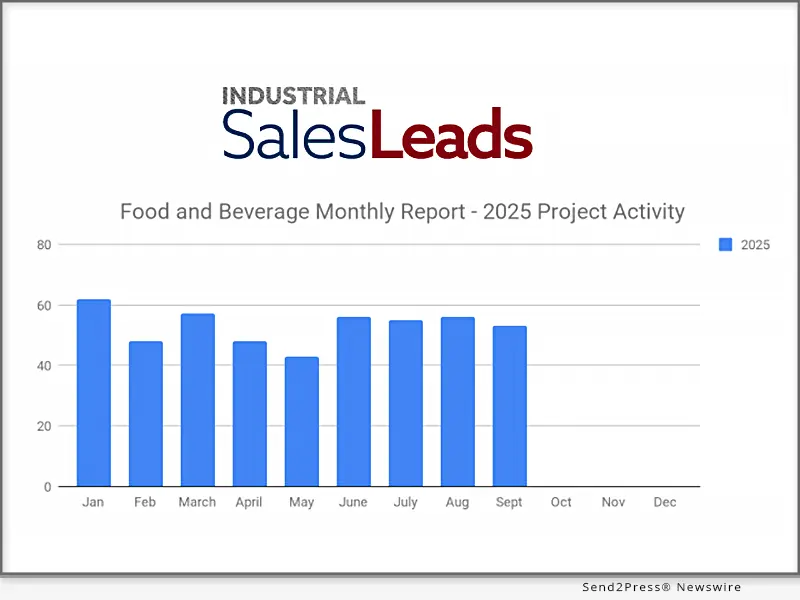
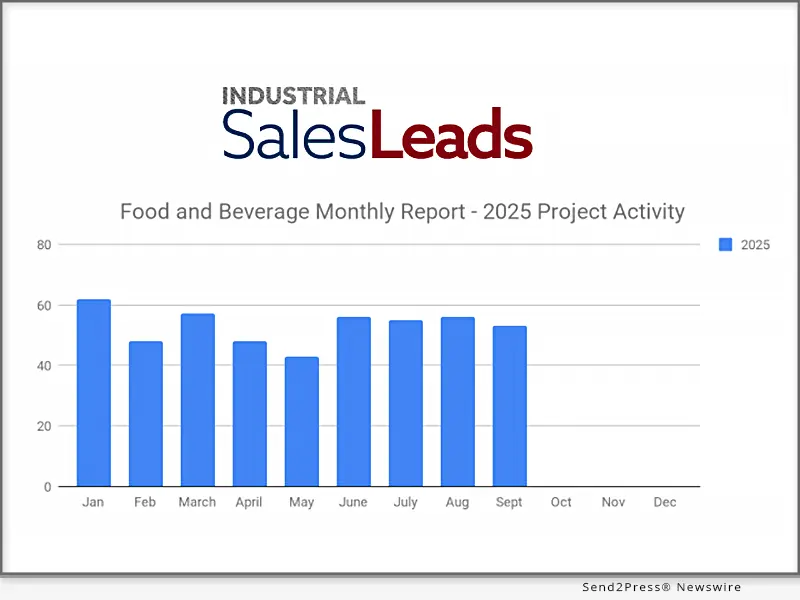
JACKSONVILLE BEACH, Fla., Feb. 10, 2026 (SEND2PRESS NEWSWIRE) — Industrial SalesLeads announced today the Food & Beverage new planned capital project spending report for January 2026. The Firm tracks North American planned industrial capital project activity; including facility expansions, new plant construction and significant equipment modernization projects. January 2026 recorded 48 new planned projects, a decline that returns activity to the previous year’s lowest level, last seen in May 2025. May 2025 also posted 48 projects, 2026 begins at the same low point.

New Food and Beverage Planned Projects Return to May 2025 Levels
Image caption: New Food and Beverage Planned Projects Return to May 2025 Levels.

The following are selected highlights on new Food and Beverage industry construction news.

FOOD AND BEVERAGE PROJECT TYPE

  • Processing Facilities – 27 New Projects
  • Distribution and Industrial Warehouse – 23 New Projects

FOOD AND BEVERAGE PROJECT SCOPE/ACTIVITY

  • New Construction – 16 New Projects
  • Expansion – 16 New Projects
  • Renovations/Equipment Upgrades – 20 New Projects
  • Plant Closing – 4 New Projects

FOOD AND BEVERAGE PROJECT LOCATION (TOP 10 STATES)

  • New York – 7
  • California – 6
  • Texas – 6
  • Florida – 3
  • Michigan – 3
  • Ohio – 3
  • Arizona – 2
  • Iowa – 2
  • Illinois – 2
  • Indiana – 2

LARGEST PLANNED PROJECT

During the month of January, our research team identified 2 new Food and Beverage facility construction projects with an estimated value of $100 million or more.

The largest project is owned by La Colombe, who is planning to invest $479 for the expansion of their processing and warehouse facility in NORTON SHORES, MI. They are currently seeking approval for the project.

TOP 10 TRACKED FOOD AND BEVERAGE PROJECTS

LOUISIANA:

Global retail chain is planning to invest $330 million for the renovation and equipment upgrades on their 1.3 million sf distribution center in OPELOUSAS, LA. They are currently seeking approval for the project.

INDIANA:

Agricultural and renewable fuels company is planning to invest $60 million for the expansion of their ethanol processing facility in LOGANSPORT, IN. Completion is slated for Summer 2027.

OKLAHOMA:

Beverage distributor is planning to invest $37 million for the construction of a 260,000 sf warehouse and office facility at 13412 E Admiral Place S in TULSA, OK. They are currently seeking approval for the project.

FLORIDA:

Brewery is planning to invest $30 million for the renovations and equipment upgrades on their production facility at 1 Busch Dr. and their manufacturing facility at 1100 Ellis Rd. in JACKSONVILLE, FL. They are currently seeking approval for the project.

KENTUCKY:

Nutritional supplement mfr. is planning to invest $26 million for the expansion, renovations, and equipment upgrades on their processing facility in ERLANGER, KY. They are currently seeking approval for the project.

FLORIDA:

Grocery retail chain is planning for the renovation and equipment upgrades on a 1 million sf distribution center at 15500 W. Beaver St. in BALDWIN, FL. They are currently seeking approval for the project. Completion is slated for 2027.

OHIO:

Specialty food processing company has recently agreed to pre-lease a 327,000 sf distribution center at 880 Hilliard Rome Rd. in COLUMBUS, OH. Completion is slated for late 2026.

PENNSYLVANIA:

Egg producer is planning for the construction of a 124,000 sf processing facility at 340 Eby Chiques Rd. in RAPHO TWP., PA. They are currently seeking approval for the project.

OHIO:

Food product distributor is planning for the renovation and equipment upgrades on a recently acquired 100,000 sf warehouse at 6575 Davis Industrial Pkwy in SOLON, OH. They are currently seeking approval for the project.

NEBRASKA:

Pet food mfr. is planning for the renovation and equipment upgrades on a 60,000 sf processing facility in FALLS CITY, NE. They are currently seeking approval for the project. Completion is slated for early Fall 2026.

ABOUT INDUSTRIAL SALESLEADS, INC.

Since 1959, Industrial SalesLeads, based in Jacksonville, FL is a leader in delivering industrial capital project intelligence and prospecting services for sales and marketing teams to ensure a predictable and scalable pipeline. Our Industrial Market Intelligence, IMI identifies timely insights on companies planning significant capital investments such as new construction, expansion, relocation, equipment modernization and plant closings in industrial facilities. The Outsourced Prospecting Services, an extension to your sales team, is designed to drive growth with qualified meetings and appointments for your internal sales team. Visit us at https://salesleadsinc.com/.

Each month, our team provides hundreds of industrial reports within a variety of industries, including:

Learn more: https://www.salesleadsinc.com/industry/food-and-beverage/

Blog: https://www.salesleadsinc.com/blog/

NEWS SOURCE: Industrial SalesLeads Inc


This press release was issued on behalf of the news source (Industrial SalesLeads Inc), who is solely responsible for its accuracy, by Send2Press Newswire. Image, if any, was provided by the news source and not this website or the wire service. Information is believed accurate, as provided by the news source, but is not guaranteed.

To view the original story, visit: https://www.send2press.com/wire/new-food-and-beverage-planned-projects-return-to-may-2025-levels/

Copr. © 2026 Send2Press® Newswire, Calif., USA. -- REF: S2P STORY ID: S2P133004 NOREL-3B


Optimal Blue report: Sub-6% rates spark refinance surge early in 2026

​​Refinances jump as execution strategies and investor demand shift

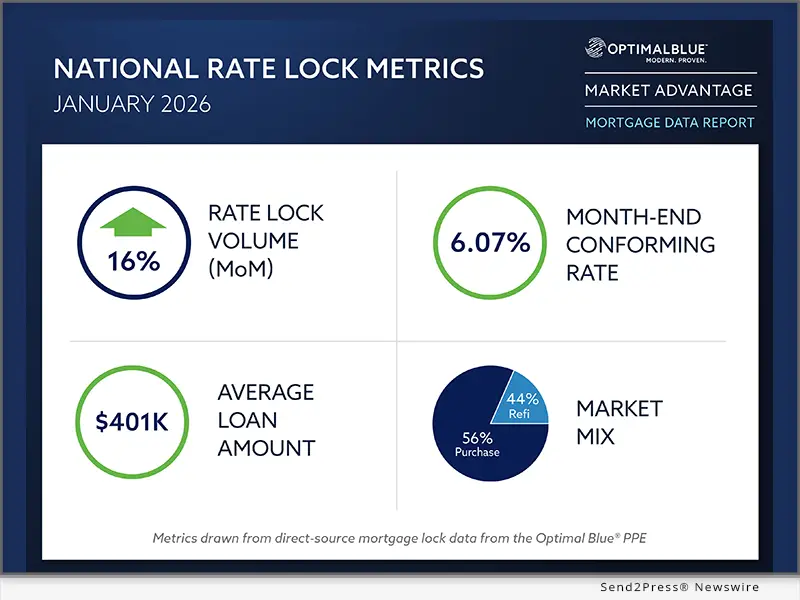
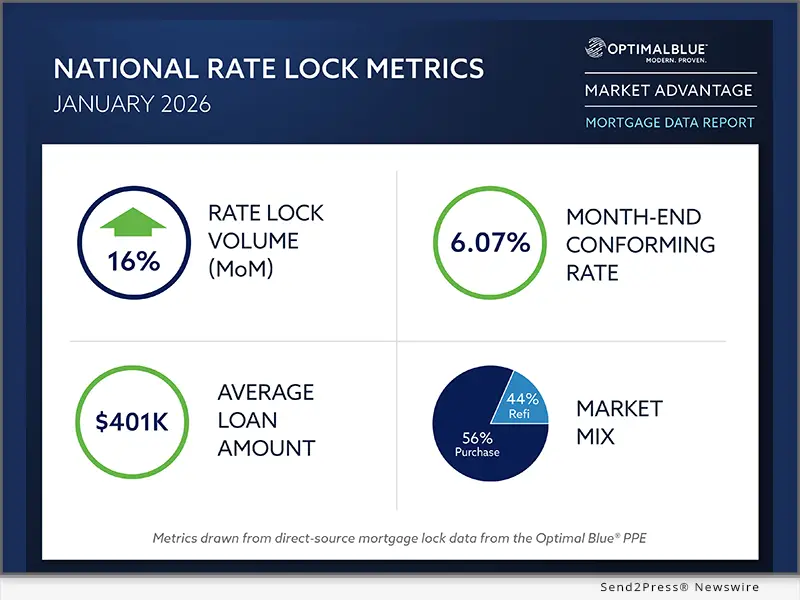
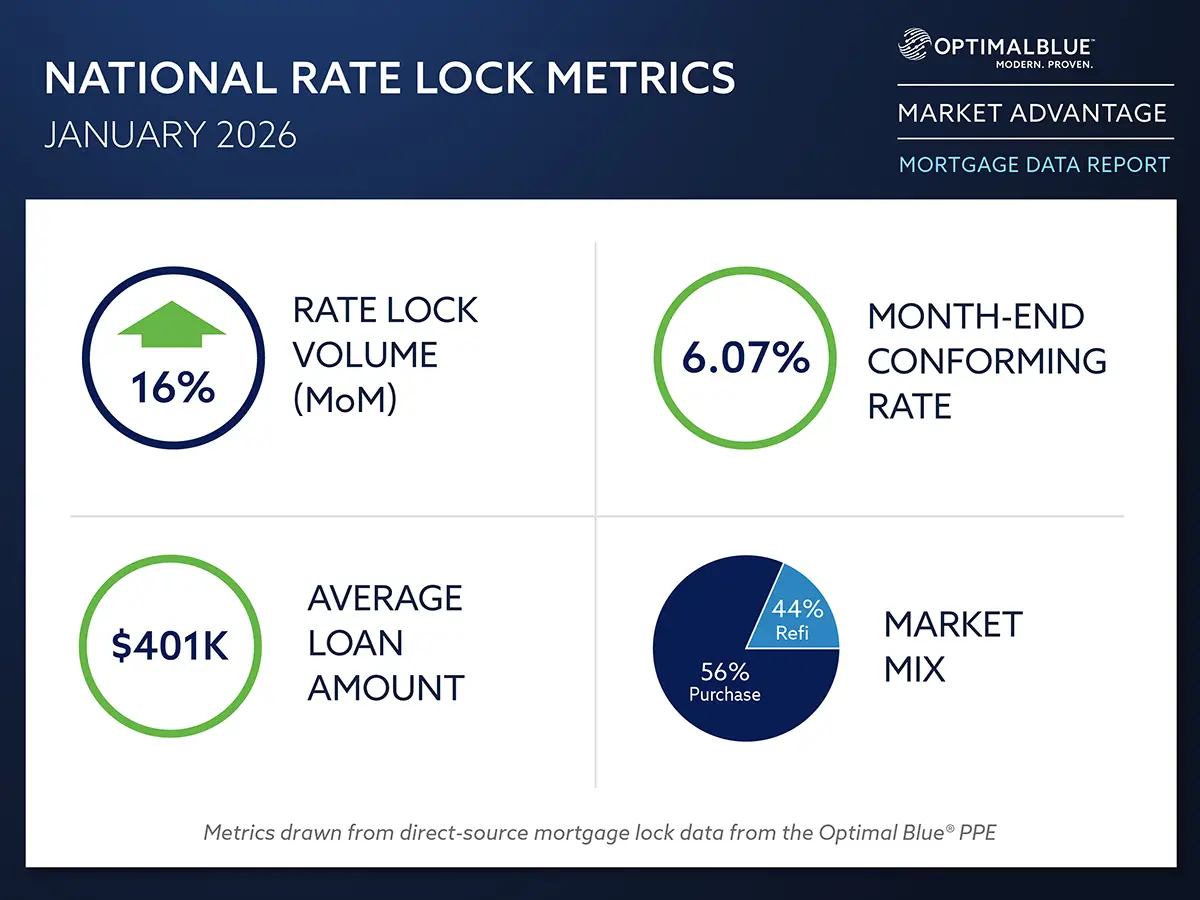
PLANO, Texas, Feb. 10, 2026 (SEND2PRESS NEWSWIRE) — Optimal Blue today released its January 2026 Market Advantage mortgage data report, showing a strong start to the year as falling rates drove a sharp increase in refinance activity. Total rate-lock volume rose 16% month over month (MoM) and finished January 36% higher year over year (YoY), led by a surge in rate-and-term refinances, which climbed 50% from December and more than 400% compared with January 2025. Cash-out refinance activity also increased, rising 11% MoM and 38% YoY. Purchase volume grew a modest 3% from December but remained down 5% from a year earlier, reflecting the slower response of purchase demand to changing rate conditions early in the year.

Optimal Blue’s January 2026 Market Advantage mortgage data report
Image caption: Optimal Blue’s January 2026 Market Advantage mortgage data report.

Mortgage rates moved lower across most products in January. The Optimal Blue Mortgage Market Indices (OBMMI) 30-year conforming fixed rate, the benchmark for CME Group’s Mortgage Rate futures, declined 7 basis points (bps) to 6.07%. Jumbo rates fell 16 bps to 6.25%, VA rates declined 7 bps to 5.64% and FHA rates were largely unchanged at 5.99%. The average locked rate on the Optimal Blue PPE fell below 6% for the first time since August 2022.

“January’s data shows just how quickly refinance demand can respond when rates move lower,” said Mike Vough, senior vice president of corporate strategy at Optimal Blue. “It’s been more than three years since the market last saw average rates with a ‘5 handle,’ and crossing back below that level appears to have released meaningful pent-up refinance demand. Purchase activity is responding more gradually, which is typical this early in the year, but the shift in borrower behavior is clear.”

On the secondary side, lenders adjusted execution strategies as pricing dynamics shifted and investor demand strengthened. Best-efforts-to-mandatory spreads increased for 30-year products, securitization activity increased and mortgage servicing rights (MSR) values rose despite declining benchmark rates, signaling a continued focus on balance sheet positioning and longer-term value.

“January’s secondary market data reflects lenders positioning early for a potentially more active origination environment,” said Vough. “Pricing trends were increasingly tied to eligibility rather than outright price give-ups, and agency MBS securitization reached its largest share since 2024. Meanwhile, rising MSR values and expanding investor participation point to a market focused on flexibility and long-term execution strategy as 2026 begins.”

Key findings from the Market Advantage report, derived from direct-source mortgage lock and secondary market data, include:

VOLUME TRENDS AND MARKET COMPOSITION

  • Sharp pickup in refis: Refinance activity surged in January as falling rates quickly translated into borrower demand. Rate-and-term refinance locks increased 50% MoM and were more than four times higher YoY. Cash-out refinances also gained momentum, rising 11% MoM and 38% YoY.
  • Purchase activity lags: Purchase volume increased a modest 3% MoM but remained down 5% YoY. The slower response reflects the typical lag in purchase demand relative to rate movements, particularly early in the year.
  • Non-QM share pulls back: Non-qualified mortgage share declined to 8% in January, down 160 bps from December but 70 bps higher YoY.
  • VA gains momentum: VA lending captured a larger share of January activity as borrowers moved quickly to take advantage of lower rates, positioning VA portfolios for increased refinance-related payoffs as those loans move through the pipeline. VA loans accounted for 14% of locks, up 125 bps MoM and 212 bps YoY.
  • PUD share retreats: Planned unit developments (PUDs) accounted for 28% of locks in January, down 95 bps MoM and 651 bps YoY.

RATES AND PRICING

  • Rates edge down: Mortgage rates moved lower across most products in January. OBMMI for the 30-year conforming fixed rate declined 7 bps to 6.07%. Jumbo rates fell 16 bps to 6.25%, VA rates declined 7 bps to 5.64% and FHA rates were largely flat at 5.99%.
  • MSR values tick higher: MSR values for conforming 30-year loans increased 2 bps to 1.16%, representing a 4.65 multiple, diverging from declining benchmark rates.
  • Spreads widen on rate moves: Best-efforts-to-mandatory spreads increased for 30-year products in January, with the conforming 30-year spread widening 3 bps and the government 30-year spread increasing 8 bps. The conforming 15-year spread narrowed by 8 bps during the month.
  • Pricing discipline persists: The share of loans sold at the highest price tier remained flat at 79%, while second-tier executions increased 200 bps to 13%, reflecting continued use of eligibility-based delivery strategies with less price concession.

CHANNEL AND EXECUTION

  • Execution mix tilts to securitization: Lenders shifted hedged execution toward agency MBS in January, with securitization share increasing 300 bps MoM to 47%, the largest share since 2024.
  • Aggregator and cash executions ease: Loan sales to bulk aggregators declined 100 bps MoM, while cash window executions also decreased 100 bps during the month.
  • Investor participation continues to expand: The number of active investors increased to 14 in January, extending the expansion in investor participation that began late last year.

PRODUCT MIX AND BORROWER PROFILES

  • Credit quality improves: Average credit scores increased for both cash-out refis (up 2 points) and rate-and-term refis (up 5 points). Credit scores also rose across all major products, including conforming (up 1 point), FHA (up 1 point) and VA (up 4 points) loans.
  • Affordability metrics improve: Purchase debt-to-income (DTI) ratios declined across all loan types in January and fell 1 to 2 percentage points YoY. The share of first-time homebuyers also increased, rising to 45% of conforming loans and 70% of FHA loans.
  • Loan amounts edge up: The average loan amount increased from $394,502 in December to $400,667. January loan amounts ranged from $868,498 in greater San Francisco to $316,638 in San Antonio. Loan-to-value ratios ranged from 70.21% in greater Los Angeles to 88.44% in San Antonio, with a national average of 80.06%.

To view the full January 2026 Market Advantage report, complete the free subscription form: https://engage.optimalblue.com/market-advantage.

Subscribers receive a report PDF each month with the latest data. Members of the press are eligible for special, advance access each month and should contact Leslie Colley to be added to the media list.

ABOUT THE MARKET ADVANTAGE REPORT

Optimal Blue issues the Market Advantage mortgage report each month to provide insight into U.S. mortgage trends and drivers of lending profitability. Data is sourced from the Optimal Blue PPE, which is used to price and lock more than one-third of all mortgages nationwide, and Optimal Blue’s hedging and loan trading system, which supports approximately 40% of loans hedged and sold into the secondary market. As the leader in mortgage capital markets technology, Optimal Blue has a direct view of both origination and secondary market activity and the interconnectedness of the two. Unlike self-reported survey data, Optimal Blue’s direct-source data accurately reflect the in-process loans in lenders’ pipelines and secondary market executions. Visit Optimal Blue’s website to subscribe to receive the free report each month.

Nothing herein shall be construed as, nor is Optimal Blue providing, any legal, trading, hedging or financial advice.

ABOUT OPTIMAL BLUE

Optimal Blue powers profitability across the mortgage capital markets ecosystem. As the industry’s only end-to-end capital markets platform, our technology, data and integrations bridge the primary and secondary markets to help lenders of all sizes maximize performance – from pricing accuracy to margin protection and every step in between. Backed by over 20 years of proven expertise, our modern, cloud-native technology delivers the real-time automation, actionable data and seamless connectivity lenders need to navigate market volatility and scale for growth. To learn more about how Optimal Blue delivers measurable ROI, visit OptimalBlue.com.

MULTIMEDIA

Inage link for media: https://www.Send2Press.com/300dpi/26-0210-s2p-opblue-300dpi.webp

Image caption: Optimal Blue’s January 2026 Market Advantage mortgage data report.

NEWS SOURCE: Optimal Blue


This press release was issued on behalf of the news source (Optimal Blue), who is solely responsible for its accuracy, by Send2Press Newswire. Image, if any, was provided by the news source and not this website or the wire service. Information is believed accurate, as provided by the news source, but is not guaranteed.

To view the original story, visit: https://www.send2press.com/wire/optimal-blue-report-sub-6-rates-spark-refinance-surge-early-in-2026/

Copr. © 2026 Send2Press® Newswire, Calif., USA. -- REF: S2P STORY ID: S2P132992 NOREL-3B


Mortgage Collaborative releases Pulse of the Network survey results and analysis

SAN DIEGO, Calif., Jan. 30, 2026 (SEND2PRESS NEWSWIRE) — The Mortgage Collaborative (TMC), the nation’s leading independent cooperative network for mortgage lenders, today released results from the latest Pulse of the Network survey, along with an analysis examining how mortgage lenders are prioritizing technology, operational efficiency, and growth strategies amid continued market pressure. The recent survey reflects insights from 38 member organizations, including independent mortgage banks and depository institutions across the United States.

TMC - The Mortgage Collaborative
Image caption: The Mortgage Collaborative.

“The Pulse of the Network gives us a clear, unfiltered view of what’s shaping lender decision-making right now,” said Jodi Hall, president and CEO of The Mortgage Collaborative. “Our members are balancing cost discipline with long-term competitiveness, and the data shows that technology, people, and partnerships are central to that equation.”

Findings from The Mortgage Collaborative’s November 2025 Pulse of the Network survey show technology implementation as lenders’ top priority for 2025–2026, driven by efforts to reduce origination costs, streamline operations, and improve the borrower experience.

KEY SURVEY HIGHLIGHTS INCLUDE:

  • Technology investment leads strategic priorities. Technology solutions ranked as lenders’ top priority, with many respondents focused on APIs, automation, and digital closing tools to reduce costs and improve efficiency across the loan lifecycle.
  • Automation and AI adoption continue to accelerate. More than half of respondents reported using APIs and automation for verifications and compliance, while lenders increasingly deploy AI-powered platforms to enhance borrower engagement and operational workflows.
  • Leadership development is a growing focus. More than three-quarters of respondents cited leadership development and employee engagement as key initiatives, reflecting increased emphasis on workforce optimization, succession planning, and performance measurement.
  • Revenue diversification remains a top growth strategy. Lenders are expanding into non-QM lending, down payment assistance programs, and home equity products to capture market share and strengthen purchase-focused business models.
  • Secondary market execution is under closer scrutiny. Nearly half of respondents are prioritizing post-close process improvements, investor diversification, and data-driven analytics to reduce execution risk and improve profitability.
  • Compliance remains complex, with fraud prevention a top concern. While compliance ranked lower in overall priority, more than half of respondents identified fraud prevention and cybersecurity as their most significant risk management challenges.

TMC uses Pulse of the Network findings to inform its strategic initiatives, conference programming, and partner solutions, ensuring members have access to relevant insights and collaborative resources aligned with current market conditions.

The full Pulse of the Network survey analysis is now available. Readers can access the published summary here.

ABOUT THE MORTGAGE COLLABORATIVE

The Mortgage Collaborative (TMC) is a membership-driven organization that empowers mortgage lenders nationwide through collaboration, education, and advocacy. TMC brings together independent mortgage banks and depository institutions to share insights, solve industry challenges, and strengthen long-term performance. For more information, visit www.mortgagecollaborative.com.

NEWS SOURCE: The Mortgage Collaborative


This press release was issued on behalf of the news source (The Mortgage Collaborative), who is solely responsible for its accuracy, by Send2Press Newswire. Image, if any, was provided by the news source and not this website or the wire service. Information is believed accurate, as provided by the news source, but is not guaranteed.

To view the original story, visit: https://www.send2press.com/wire/mortgage-collaborative-releases-pulse-of-the-network-survey-results-and-analysis/

Copr. © 2026 Send2Press® Newswire, Calif., USA. -- REF: S2P STORY ID: S2P132628 NOREL-3B


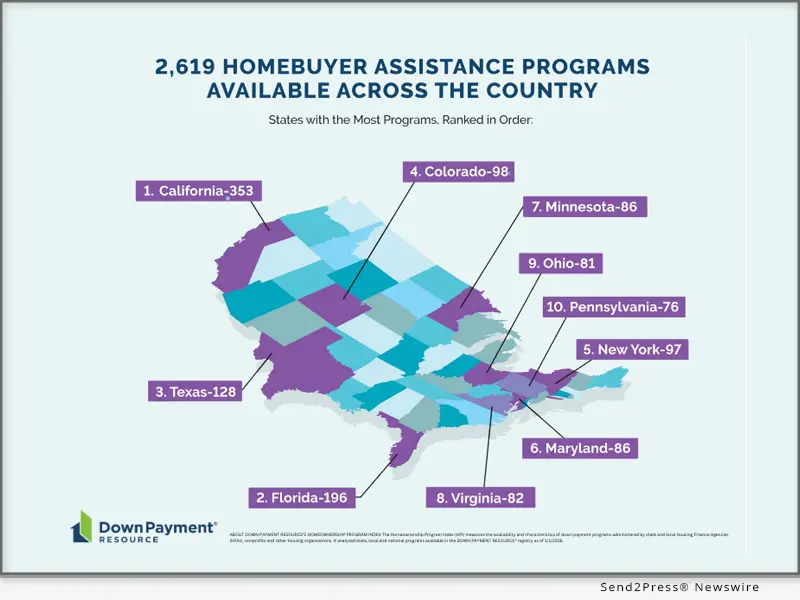
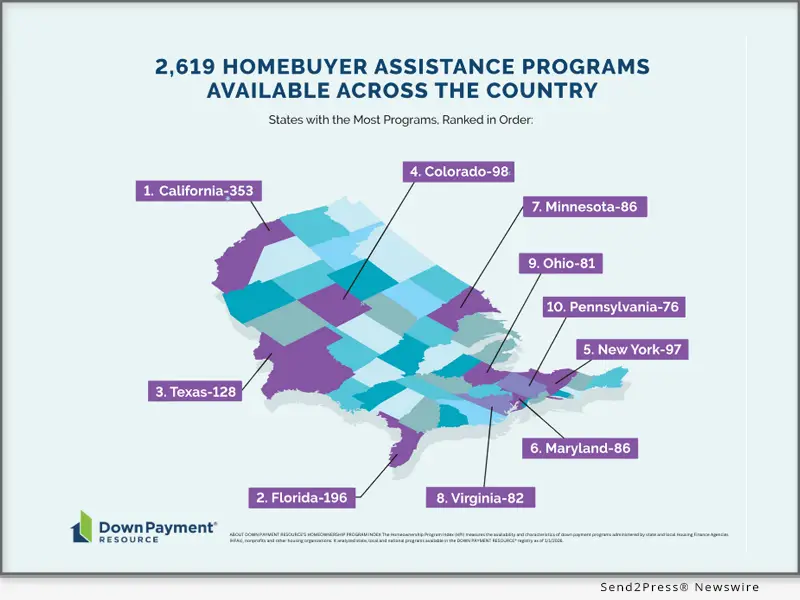
Down Payment Resource finds 2,619 homebuyer assistance programs nationwide in Q4 of 2025

Program count for the year's final quarter is up 6% from last year, holding near record levels

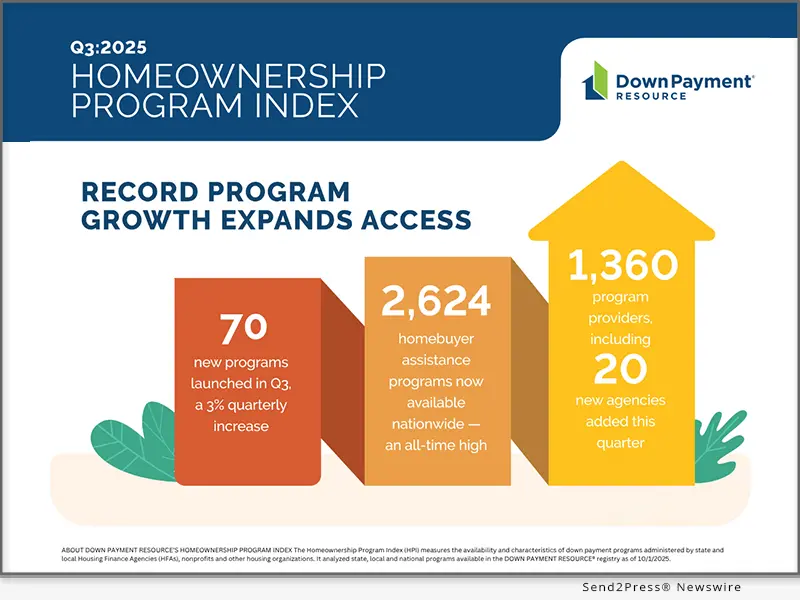
ATLANTA, Ga., Jan. 26, 2026 (SEND2PRESS NEWSWIRE) — Down Payment Resource (DPR), the housing industry authority on homeownership program data and solutions, today released its Q4 2025 Homeownership Program Index (HPI) report, identifying 2,619 programs. While the total count is five programs fewer than the prior quarter, it marked a 6% increase from a year earlier, rising from 2,466 programs in Q4 2024. The year-over-year (YoY) growth reflects continued expansion and refinement of program options amid persistent housing affordability challenges across much of the country.

Down Payment Resource finds 2,619 homebuyer assistance programs nationwide in Q4
Image caption: Down Payment Resource finds 2,619 homebuyer assistance programs nationwide in Q4.

Down payment assistance (DPA) continues to play a critical role in helping lenders expand access to homeownership. On average, these programs provide approximately $18,000 in benefits, reducing a homebuyer’s loan-to-value ratio by 8.8% and strengthening borrower qualification and overall loan profiles. Beyond down payments, many programs also help cover closing costs, prepaid expenses, mortgage rate buydowns and reductions in mortgage insurance costs. In some cases, eligible buyers can layer multiple programs to further improve affordability.

“Affordability will remain the defining challenge for homebuyers in 2026, and down payment programs are one of the most practical tools lenders have to address it,” said DPR Founder and CEO Rob Chrane. “When DPA lowers loan-to-value ratios and helps cover upfront costs, it doesn’t just improve borrower eligibility; it improves loan quality. As prices remain elevated and rates fluctuate, lenders that proactively integrate DPA into their origination strategies are better positioned to turn qualified demand into sustainable homeownership.”

KEY Q4 2025 HPI REPORT FINDINGS:

An examination of the 2,619 homeownership programs on January 1, 2026, resulted in the following key findings:

  • Every U.S. county has at least one DPA program, and more than 2,000 have 10 or more. By state, California has the most with 353 programs from 223 providers. Florida has 196 programs from 128 providers. Texas has 128 programs from 63 providers.
  • Benefits and home income caps are rising. 1,599 programs (62%) have an average income limit exceeding $100k across the program’s footprint. Additionally, 270 programs (10%) do not have income restrictions, thereby increasing the number of buyers who may qualify for assistance. This “income-free” requirement represents a 15% YoY increase, giving lenders a wider box to qualify borrowers.
  • Support for first-time buyers and first-gen buyers. 1,639 programs (63%) are open to first-time buyers, an 8% YoY rise. First-generation homebuyers are supported by 33 programs, a 32% YoY increase. First-generation homebuyers are defined as buyers and their parents who have never owned a home. 980 programs (37%) are available to repeat buyers, a 3% YoY increase.
  • Servicemembers and Veterans are exempted from 246 programs (9%). This exemption allows them to qualify even if they have previously purchased a residence, representing a 12% YoY increase.
  • Buyers of newly constructed homes are supported by 2,113 (81%) of the programs. These programs typically help cover a portion of the buyer’s down payment and/or closing costs, similar to assistance for resale properties. This is a slight increase from Q3 and is a new data point being tracked by DPR with no historical YoY data.
  • Buyers of multi-family housing (1-4 units) are eligible for 923 programs, a 15% YoY increase. Of these, a growing number of programs support purchasing three-unit homes (607) and four-unit homes (580), both of which saw a 13% YoY increase. Investing in multifamily properties can generate cash flow and offer tax advantages to buyers.
  • Buyers of manufactured housing are supported by 1,014 programs, a slight slide from the previous quarter but 14% higher YoY. New manufactured homes cost roughly $85 per square foot, compared with about $166 per square foot for site-built homes, according to the Manufactured Housing Institute, highlighting the relative affordability of manufactured homes.
  • Program types vary widely. The majority of programs (1,461, or 56%) are second-mortgage programs, up 4% YoY, while 242 programs are first-mortgage programs, up 1% YoY. 37 were “other assistance” programs, meaning they consist of components that don’t neatly fit into the other categories, such as an interest rate reduction benefit. Other assistance programs are 85% higher YoY. 273 are combined assistance programs, 18% higher YoY. 207 programs are grants, up 17% YoY. 139 programs are below-market-rate (BMR) or resale-restricted, up 49% YoY, giving low- to moderate-income households more opportunities to achieve homeownership.
  • The majority of DPA loans are structured to be forgivable. 1,035 DPA programs (53%) offer partial or full forgiveness over time — a 5% YoY increase. These programs may require that homebuyers meet specific requirements, such as living in the home as their primary residence for a certain number of years.
  • DPA is offered by a wide variety of providers. 1,027 programs (39%) were offered through municipalities or local program providers, a 6% YoY increase. 562 programs (21%) are sponsored by nonprofits, a 7% YoY increase. State housing authorities (HFAs) accounted for 466 (18%) of programs, 1% higher YoY.
  • Some programs offer special incentives based on the buyer’s occupation or other characteristics. Of the 201 special incentive programs, 71 (35%) support educators, up 4% YoY. 56 programs (28%) assist Native American homebuyers, 19% higher YoY. 54 programs (27%) are available to military Veterans (up 10% YoY).

A more detailed analysis of the Q4 2025 HPI findings, including infographics and examples of the programs described in this release, can be found on DPR’s website at: https://downpaymentresource.com/professional-resource/down-payment-assistance-holds-near-record-levels-in-q4-2025-as-program-flexibility-expands/

For a complete list of homebuyer assistance programs by state, visit: https://downpaymentresource.com/wp-content/uploads/2026/01/HPI-state-by-state-data.Q42025.pdf

Members of the media are encouraged to contact DPR for data specific to their reporting needs.

METHODOLOGY:

Published quarterly, DPR’s HPI surveys the funding status, eligibility rules and benefits of U.S. homebuyer assistance programs administered by state and local housing finance agencies, municipalities, nonprofits and other housing organizations. DPR communicates with over 1,300 program providers throughout the year to track and update the country’s wide range of homeownership programs, including down payment and closing cost programs, Mortgage Credit Certificates (MCCs) and affordable first mortgages, in the DOWN PAYMENT RESOURCE® database.

ABOUT DOWN PAYMENT RESOURCE:

With a database that tracks over 2,600 programs and toolsets for mortgage lenders, multiple listing services (MLSs) and API users, Down Payment Resource (DPR) is the housing industry’s authority on homeownership program data and solutions, helping housing professionals connect homebuyers with the assistance they need. DPR frequently lends its expertise to nonprofits, housing finance agencies, policymakers, government-sponsored enterprises and trade organizations seeking to improve housing affordability. Its technology is used by seven of the top 25 mortgage lenders, two of the largest real estate listing websites and 600,000 real estate agents. For more information, visit www.downpaymentresource.com.

X: @DwnPmtResource #downpaymentassistance #downpayment

NEWS SOURCE: Down Payment Resource


This press release was issued on behalf of the news source (Down Payment Resource), who is solely responsible for its accuracy, by Send2Press Newswire. Image, if any, was provided by the news source and not this website or the wire service. Information is believed accurate, as provided by the news source, but is not guaranteed.

To view the original story, visit: https://www.send2press.com/wire/down-payment-resource-finds-2619-homebuyer-assistance-programs-nationwide-in-q4-of-2025/

Copr. © 2026 Send2Press® Newswire, Calif., USA. -- REF: S2P STORY ID: S2P132476 NOREL-3B


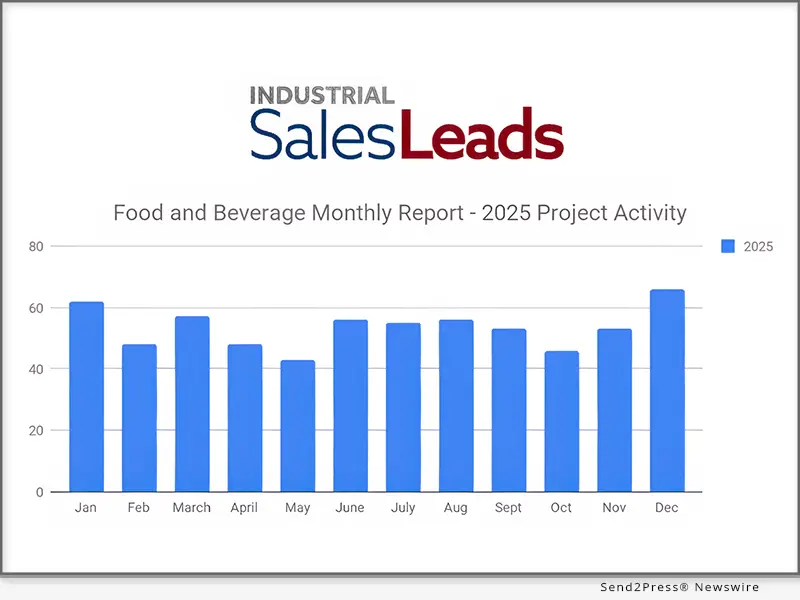
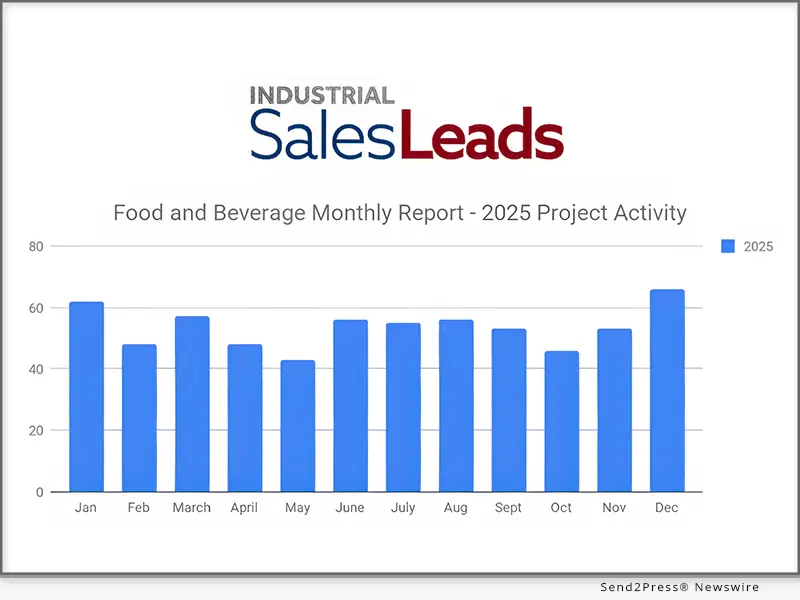
Food & Beverage Capital Projects Jump 38% Since May, Rising from 48 to 66 Planned Projects by December 2025

JACKSONVILLE BEACH, Fla., Jan. 15, 2026 (SEND2PRESS NEWSWIRE) — Industrial SalesLeads announced the December 2025 results of its Food and Beverage industry planned capital project spending report, pointing to a strong rebound in project activity. The firm, which tracks North American planned industrial capital projects including facility expansions, new plant construction, and major equipment modernization initiatives, identified 66 new Food and Beverage projects in December, up from 53 projects in November. Compared with the sector’s low point in May 2025, when 48 projects were reported, December activity reflects approximately 38 percent growth, signaling renewed momentum and increased capital investment across the Food and Beverage industry.

Food and Beverage Capital Projects Jump 38% Since May, Rising from 48 to 66 Planned Projects by December 2025
Image caption: Food and Beverage Capital Projects Jump 38% Since May, Rising from 48 to 66 Planned Projects by December 2025.

The following are selected highlights on new Food and Beverage industry construction news.

FOOD AND BEVERAGE PROJECT TYPE

Processing Facilities – 45 New Projects

Distribution and Industrial Warehouse – 28 New Projects

FOOD AND BEVERAGE PROJECT SCOPE/ACTIVITY

New Construction – 25 New Projects

Expansion – 16 New Projects

Renovations/Equipment Upgrades – 24 New Projects

Plant Closing – 9 New Projects

FOOD AND BEVERAGE PROJECT LOCATION (TOP 10 STATES)

Wisconsin – 7

New York – 6

Ohio – 6

Pennsylvania – 5

California – 4

Florida – 4

Connecticut – 3

Iowa – 3

New Jersey – 3

Indiana – 2

LARGEST PLANNED PROJECT

During the month of December, our research team identified 7 new Food and Beverage facility construction projects with an estimated value of $100 million or more.

The largest project is owned by Swire Coca-Cola., who is planning to invest $475 million for the construction of a 620,000 sf processing facility in COLORADO SPRINGS, CO. They are currently seeking approval for the project. Completion is slated for 2028.

TOP 10 TRACKED FOOD AND BEVERAGE PROJECTS

KENTUCKY:

Grocery retail chain is planning to invest $391 million for the construction of a distribution center in FRANKLIN, KY. They are currently seeking approval for the project.

NEW YORK:

Beverage company is planning to invest $200 million for the construction of a 512,000 sf processing and distribution facility in PERTH, NY. They are currently seeking approval for the project.

FLORIDA:

Restaurant chain is planning to invest $150 million for the construction of a 244,000 sf distribution center in WINTER HAVEN, FL. They are currently seeking approval for the project. Completion is slated for 2027.

IOWA:

Specialty food mfr. is planning to invest $130 million for the construction of a processing and warehouse facility in SIOUX CITY, IA. They are currently seeking approval for the project.

ARKANSAS:

Meat product mfr. is planning to invest $127 million for the renovation and equipment upgrades on a processing facility at 730 E. Randall Wobbe Ln. in SPRINGDALE, AR. They are currently seeking approval for the project.

MISSISSIPPI:

Poultry processing company is planning to invest $75 million for an expansion of their processing facility in LAUREL, MS. They have recently received approval for the project.

MICHIGAN:

Dairy Cooperative is planning to invest $74 million for the renovation and equipment upgrades on a recently acquired processing facility at 311 N. Sheridan Ave. in REMUS, MI. They are currently seeking approval for the project.

NEW YORK:

Specialty ingredient mfr. Is planning to invest $36 million for the construction of a processing facility at 36 Fini Drive in WALLKILL, NY. They are currently seeking approval for the project. Completion is slated for 2027.

CONNECTICUT:

Beverage distributor is planning for the renovation and equipment upgrades on a recently leased 241,000 sf distribution facility at 160 Corporate Ct. in MERIDEN, CT. They are currently seeking approval for the project.

CALIFORNIA:

Beverage packaging company is planning for the renovation and equipment upgrades on a recently acquired 213,000 sf processing facility in SACRAMENTO, CA. They are currently seeking approval for the project.

ABOUT INDUSTRIAL SALESLEADS, INC.

Since 1959, Industrial SalesLeads, based in Jacksonville, FL is a leader in delivering industrial capital project intelligence and prospecting services for sales and marketing teams to ensure a predictable and scalable pipeline. Our Industrial Market Intelligence, IMI identifies timely insights on companies planning significant capital investments such as new construction, expansion, relocation, equipment modernization and plant closings in industrial facilities. The Outsourced Prospecting Services, an extension to your sales team, is designed to drive growth with qualified meetings and appointments for your internal sales team. Visit us at https://salesleadsinc.com/.

Each month, our team provides hundreds of industrial reports within a variety of industries, including:

LEARN MORE:

https://www.salesleadsinc.com/blog/

https://www.salesleadsinc.com/industry/food-and-beverage/

NEWS SOURCE: Industrial SalesLeads Inc


This press release was issued on behalf of the news source (Industrial SalesLeads Inc), who is solely responsible for its accuracy, by Send2Press Newswire. Image, if any, was provided by the news source and not this website or the wire service. Information is believed accurate, as provided by the news source, but is not guaranteed.

To view the original story, visit: https://www.send2press.com/wire/food-beverage-capital-projects-jump-38-since-may-rising-from-48-to-66-planned-projects-by-december-2025/

Copr. © 2026 Send2Press® Newswire, Calif., USA. -- REF: S2P STORY ID: S2P132333 NOREL-3B


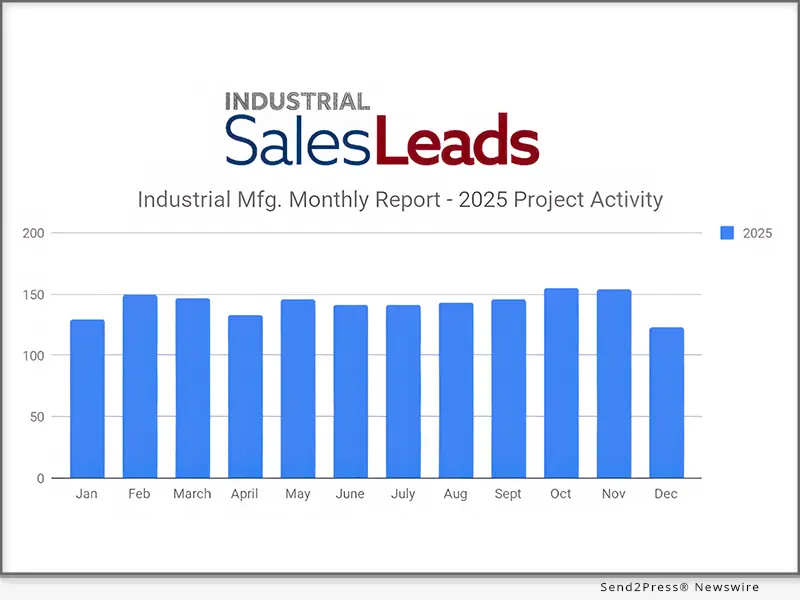
New Industrial Manufacturing Project Fell 20% in December, Weakest Showing in 2025

Research identified 123 new Industrial Manufacturing projects in December, representing a 20% decline from November

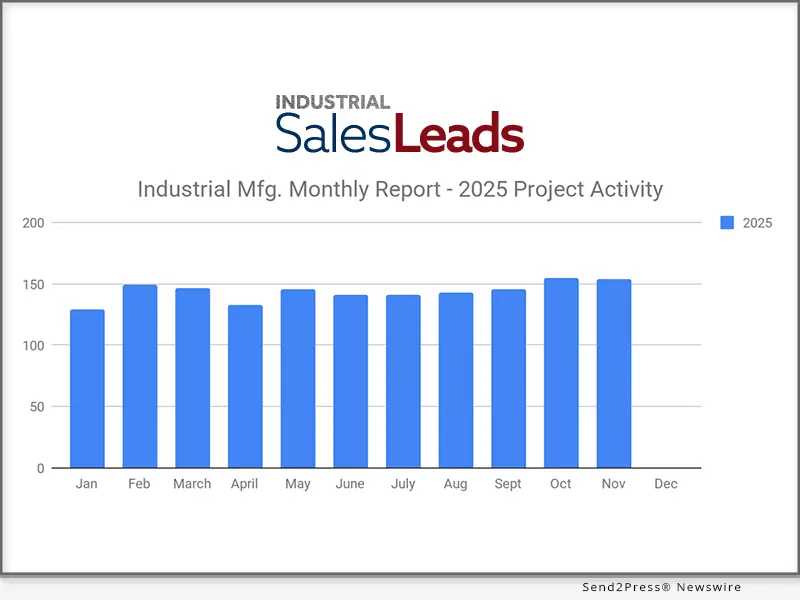
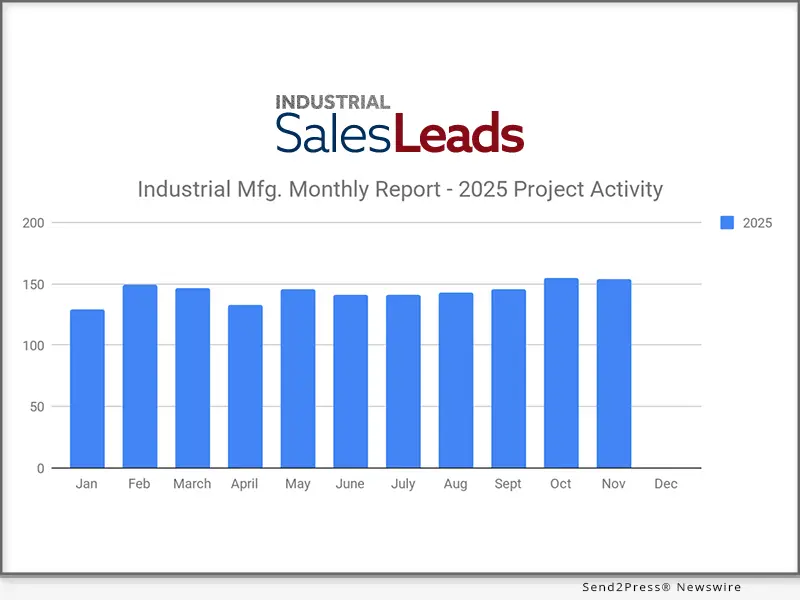
JACKSONVILLE BEACH, Fla., Jan. 13, 2026 (SEND2PRESS NEWSWIRE) — Industrial SalesLeads released its December 2025 analysis of planned capital investment activity within the Industrial Manufacturing sector. The report monitors upcoming North American industrial projects, including plant expansions, new construction, and large-scale equipment upgrades. Research identified 123 new Industrial Manufacturing projects in December, representing a 20% decline from November, when 154 projects were recorded, marking December as the weakest month of 2025 for new project activity.

New Industrial Manufacturing Project Fell 20% in December, Weakest Showing in 2025
Image caption: New Industrial Manufacturing Project Fell 20% in December, Weakest Showing in 2025.

The following are selected highlights on new Industrial Manufacturing industry construction news.

Industrial Manufacturing – By Project Type

Manufacturing/Production Facilities – 114 New Projects

Distribution and Industrial Warehouse – 70 New Projects

Industrial Manufacturing – By Project Scope/Activity

New Construction – 26 New Projects

Expansion – 43 New Projects

Renovations/Equipment Upgrades – 75 New Projects

Plant Closings – 7 New Projects

Industrial Manufacturing – By Project Location (Top 10 States)

North Carolina – 10

Indiana – 9

New York – 8

Wisconsin – 8

California – 7

Pennsylvania – 7

South Carolina – 7

Texas – 6

Iowa – 5

Kentucky – 5

Ohio – 5

Largest Planned Project

Research conducted in November uncovered 14 new Industrial Manufacturing construction projects with estimated investments of at least $100 million.

The largest project is owned by Korea Zinc, who is planning to invest $7 billion for the construction of a processing facility in CLARKSVILLE, TN. They are currently seeking approval for the project. Completion is slated for 2029.

Top 10 Tracked Industrial Manufacturing Projects

ALABAMA:

Pharmaceutical company is planning to invest $6 billion for the construction of a processing and laboratory facility in HUNTSVILLE, AL. They are currently seeking approval for the project. Construction is expected to start in 2026, with completion slated for 2032.

MARYLAND:

Pharmaceutical company is planning to invest $2 billion for the expansion, renovation, and equipment upgrades on their processing facilities in FREDERICK, MD. The project includes the construction of a processing and laboratory facility in GAITHERSBURG, MD. They are currently seeking approval for the project.

VIRGINIA:

Global aerospace and defense company is considering investing $1 billion for the construction of a manufacturing facility and currently seeking a site in VIRGINIA. Watch SalesLeads for updates.

NORTH CAROLINA:

Pharmaceutical company is planning to invest $771 million for the expansion, renovations, and equipment upgrades on their processing and warehouse facilities in DURHAM, NC. The project includes the renovation and equipment upgrades on a 202,000 sf processing facility in MORRISVILLE, NC. Completion is slated for early 2028.

VIRGINIA:

Wire and cable mfr. is planning to invest $689 million for the construction of a manufacturing facility in CHESAPEAKE, VA. They are currently seeking approval for the project. Construction is expected to start in Summer 2026, with completion slated for late 2027.

UTAH:

Medical device mfr. is planning to invest $615 million for the expansion and equipment upgrades on their manufacturing facility in SALT LAKE CITY, UT. They are currently seeking approval for the project.

TEXAS:

Electronic mfr. is planning to invest $200 million for the renovation and equipment upgrades on a recently leased manufacturing facility at 1069 FM 3349 in TAYLOR, TX. They are currently seeking approval for the project.

PENNSYLVANIA:

Steel producer is planning to invest $195 million for the expansion and equipment upgrades on their manufacturing facility in BUTLER TWP., PA. They are currently seeking approval for the project. Completion is slated for Summer 2028.

MINNESOTA:

Building materials mfr. is planning to invest $157 million for the construction of a 250,000 sf manufacturing facility in NORTH BRANCH, MN. They are currently seeking approval for the project.

SOUTH CAROLINA:

Automotive component mfr. is planning to invest $120 million for the construction of a 400,000 sf manufacturing facility at 4100 St. Matthews Rd. in ORANGEBURG, SC. They have recently received approval for the project. Completion is slated for 2027.

About Industrial SalesLeads, Inc.

Since 1959, Industrial SalesLeads, based in Jacksonville, FL is a leader in delivering industrial capital project intelligence and prospecting services for sales and marketing teams to ensure a predictable and scalable pipeline. Our Industrial Market Intelligence, IMI identifies timely insights on companies planning significant capital investments such as new construction, expansion, relocation, equipment modernization and plant closings in industrial facilities. The Outsourced Prospecting Services, an extension to your sales team, is designed to drive growth with qualified meetings and appointments for your internal sales team. Visit us at salesleadsinc.com.

Each month, our team provides hundreds of industrial reports within a variety of industries, including:

NEWS SOURCE: Industrial SalesLeads Inc


This press release was issued on behalf of the news source (Industrial SalesLeads Inc), who is solely responsible for its accuracy, by Send2Press Newswire. Image, if any, was provided by the news source and not this website or the wire service. Information is believed accurate, as provided by the news source, but is not guaranteed.

To view the original story, visit: https://www.send2press.com/wire/new-industrial-manufacturing-project-fell-20-in-december-weakest-showing-in-2025/

Copr. © 2026 Send2Press® Newswire, Calif., USA. -- REF: S2P STORY ID: S2P132233 NOREL-3B


Optimal Blue report: December lock volume closes 2025 on a firm footing

Refinance momentum drives year-end activity despite holiday headwinds

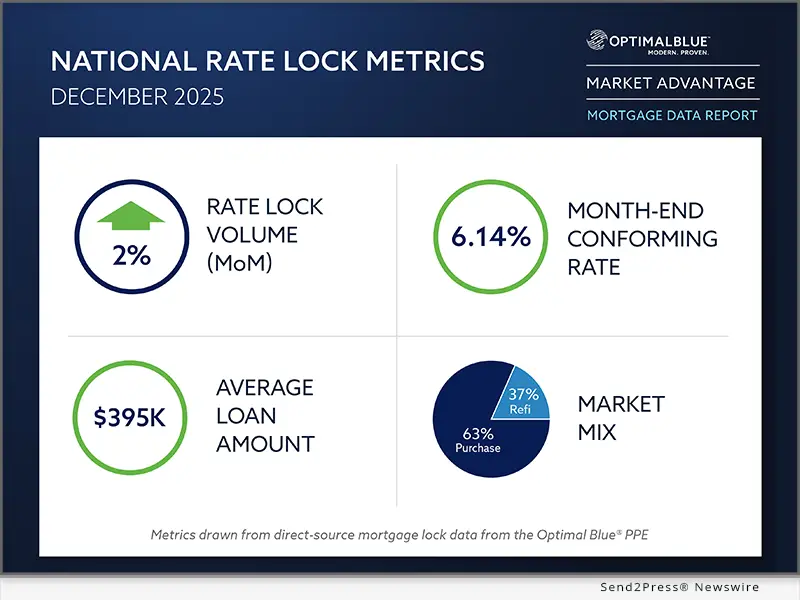
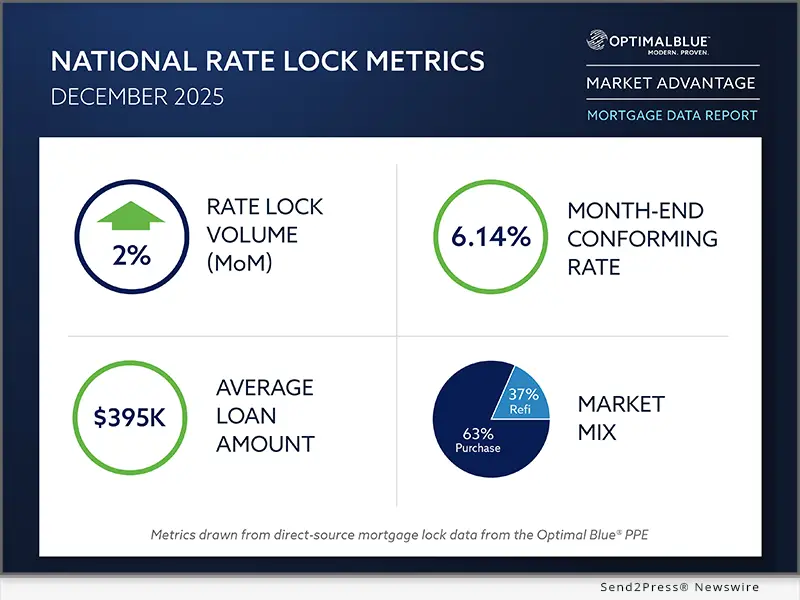
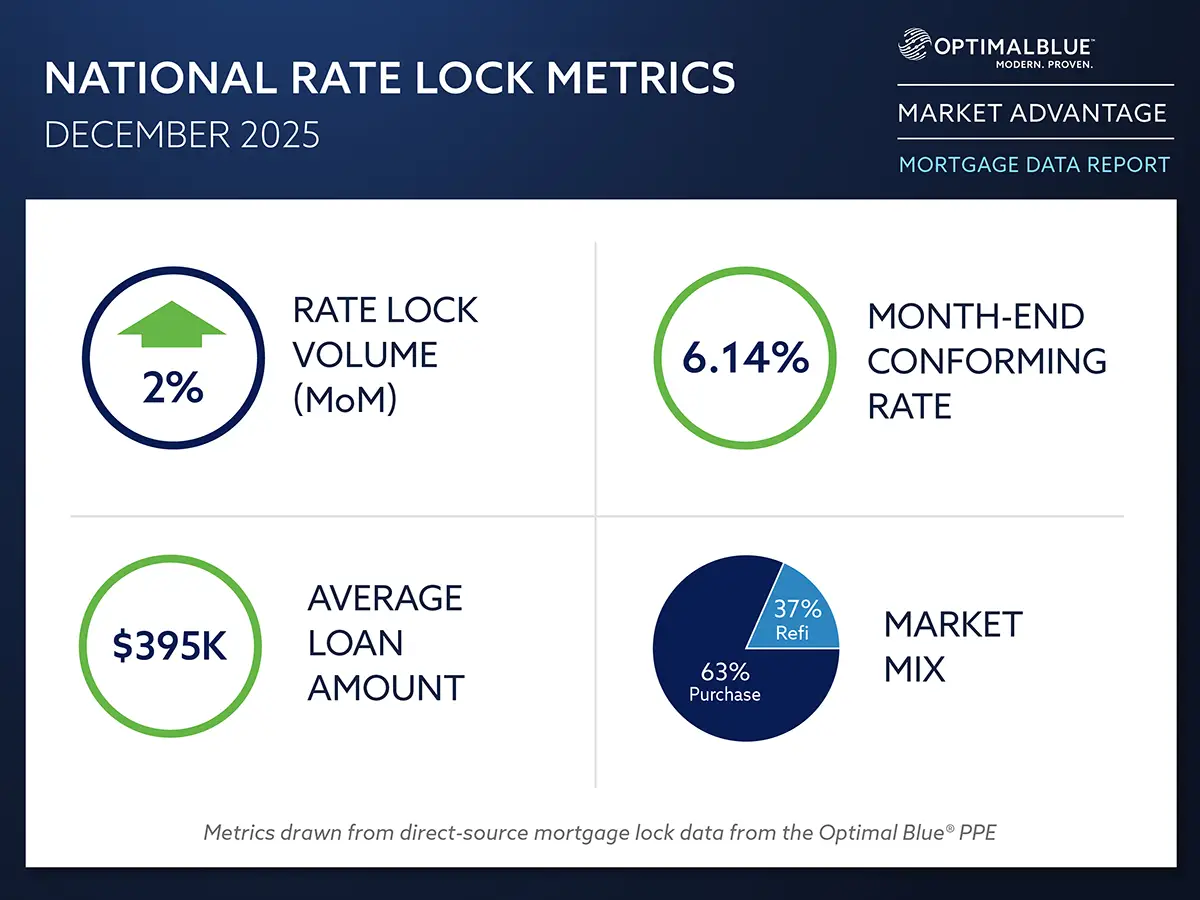
PLANO, Texas, Jan. 13, 2026 (SEND2PRESS NEWSWIRE) — Optimal Blue today released its December 2025 Market Advantage mortgage data report, showing that mortgage rate-lock activity ended the year on a firm footing, bucking typical holiday-driven seasonality. Total lock volume rose 2% month over month (MoM) from November and finished 30% higher year over year (YoY), driven primarily by rate-and-term refinances, which climbed 13% from November and more than 170% compared with December 2024. Cash-out refinance volume rose a modest 1% MoM but remained up a strong 35% YoY. Purchase activity dipped just 1% from November despite holiday headwinds to end December up 7% YoY.

Optimal Blue's December 2025 Market Advantage mortgage data report
Image caption: Optimal Blue’s December 2025 Market Advantage mortgage data report.

Mortgage rates were largely stable in December. The Optimal Blue Mortgage Market Indices (OBMMI) 30-year conforming fixed rate, the benchmark for CME Group’s Mortgage Rate futures, finished the month flat at 6.14%. Meanwhile, the 10-year Treasury yield rose 14 basis points (bps) to 4.14%, reversing November’s spread widening and pushing the 10-year-to-OBMMI spread to 200 bps at year-end.

“Finishing the year with higher lock volume in December is a clear signal that borrower demand has adjusted to today’s rate environment,” said Mike Vough, senior vice president of corporate strategy at Optimal Blue. “Refinance activity continues to do the heavy lifting, but the fact that purchase volume held essentially flat month over month and finished the year higher than last December speaks to a market that is more durable than many expected.”

Lenders also made notable adjustments on the secondary side as pricing dynamics and execution strategies evolved. Best-efforts-to-mandatory spreads widened across products, bulk aggregator execution regained share, and mortgage servicing rights (MSR) values increased despite flat primary rates.

“December’s secondary data shows lenders actively recalibrating execution as spreads widened and pricing discipline remained tight,” Vough said. “The shift back toward bulk aggregation, combined with stable top-tier pricing and rising MSR values, reflects investor demand that is focused on end-of-year balance sheet management and long-term value as we head into 2026.”

Key findings from the Market Advantage report, derived from direct-source mortgage lock and secondary market data, include:

Volume trends and market composition

  • Refinance share expands: Refinances accounted for 37% of all locks in December, up 224 bps MoM and 1,354 bps YoY. Rate-and-term refinance volume increased 13% MoM and more than 170% YoY, while cash-out refinances rose 1% MoM and 35% YoY. Overall refinance pull-through improved 194 bps from November to 69.2%.
  • Purchase market remains resilient: Purchase locks slipped just 1% MoM despite typical holiday-driven seasonality and finished December 7% higher than a year earlier. Pull-through for purchase loans increased 199 bps MoM to 85.7%.
  • Non-QM sets another record: Non-qualified mortgage production maintained its upward trajectory, finishing December above 9% of locks, up 50 bps MoM.
  • Government and non-conforming gain share: Conforming loans accounted for 51% of locks in December, down 86 bps MoM and 18 bps YoY. Non-conforming share rose to 17%, up 17 bps MoM and 141 bps YoY. FHA, VA and USDA loans each gained share during the month.
  • PUD share remains sizable: Planned unit developments (PUDs) accounted for 29% of locks by property type, up 123 bps MoM but below year-ago levels, when PUD share was higher.

Rates and pricing

  • Rates largely unchanged: The OBMMI 30-year conforming fixed rate ended December flat at 6.14%. FHA rates declined 1 bp to 5.98%, VA rates fell 6 bps to 5.71% and jumbo rates dropped 3 bps to 6.41%.
  • MSR values move higher: MSR values for conforming 30-year loans increased 5 bps to 1.14%, representing a 4.57 multiple, rising despite largely stable primary rates.
  • Treasury yields rise as spreads widen: The 10-year Treasury yield increased 14 bps to 4.14% in December, compressing the mortgage–Treasury spread to 200 bps. Best-efforts-to-mandatory spreads widened across products, including a 2-bp increase for conforming 30-year loans and a 3-bp increase for government 30-year loans.
  • Top-tier pricing holds: The share of loans sold at the highest price tier remained flat at 79%, while second-tier share was unchanged at 11%, reflecting continued pricing discipline across the market.

Channel and execution

  • Execution mix shifts back toward aggregators: Lenders adjusted hedged execution strategies in December as bulk aggregators regained share at the expense of agency securitization and cash window channels.
  • Bulk aggregator share rebounds: Hedged loan sales to bulk aggregators increased 200 bps MoM to 29%, reversing a multi-month decline.
  • Securitization and cash window ease: Agency mortgage-backed securities (MBS) executions and cash window sales each declined 100 bps during the month.
  • Investor participation increases: The number of active investors rose to 12 in December after holding steady at 11 for four consecutive months, modestly expanding execution options for lenders.

Product mix and borrower profiles

  • Credit scores edge lower: The average borrower credit score declined to 732 in December from 733 in November, extending a gradual pullback from 746 in September.
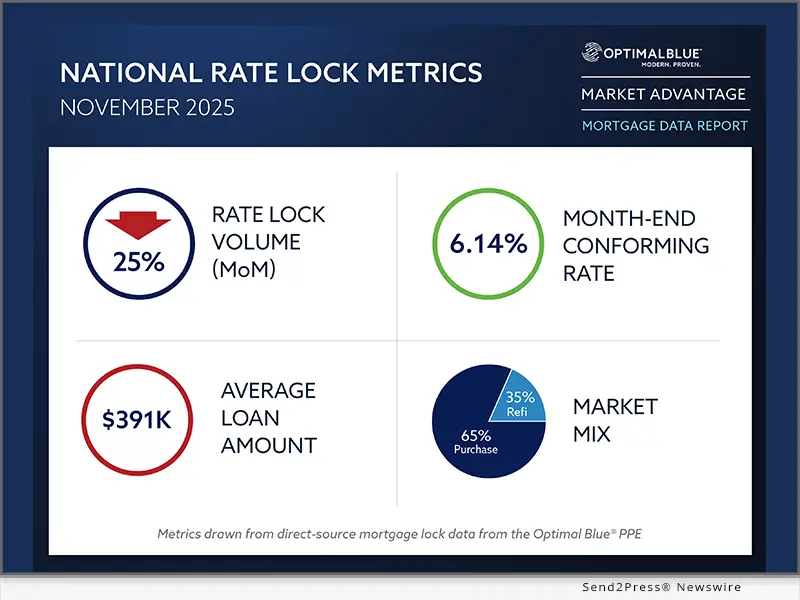
  • Loan sizes rise as leverage varies by market: The average loan amount increased to $394,502 from $391,323 in November. Loan sizes ranged from $812,240 in Los Angeles to $315,735 in San Antonio. Loan-to-value ratios ranged from 68.85% in the San Francisco–Oakland Bay Area to 87.69% in San Antonio, with a national average of 80.10%.

To view the full December 2025 Market Advantage report, complete the free subscription form: https://engage.optimalblue.com/market-advantage. Subscribers receive a report PDF each month with the latest data. Members of the press are eligible for special, advance access each month and should contact Olivia DeLancey to be added to the media list.

About the Market Advantage Report

Optimal Blue issues the Market Advantage mortgage report each month to provide insight into U.S. mortgage trends and drivers of lending profitability. Data is sourced from the Optimal Blue PPE, which is used to price and lock more than one-third of all mortgages nationwide, and Optimal Blue’s hedging and loan trading system, which supports approximately 40% of loans hedged and sold into the secondary market. As the leader in mortgage capital markets technology, Optimal Blue has a direct view of both origination and secondary market activity and the interconnectedness of the two. Unlike self-reported survey data, Optimal Blue’s direct-source data accurately reflect the in-process loans in lenders’ pipelines and secondary market executions. Visit Optimal Blue’s website to subscribe to receive the free report each month.

Nothing herein shall be construed as, nor is Optimal Blue providing, any legal, trading, hedging or financial advice.

About Optimal Blue

Optimal Blue powers profitability across the mortgage capital markets ecosystem. As the industry’s only end-to-end capital markets platform, our technology, data and integrations bridge the primary and secondary markets to help lenders of all sizes maximize performance – from pricing accuracy to margin protection and every step in between. Backed by over 20 years of proven expertise, our modern, cloud-native technology delivers the real-time automation, actionable data and seamless connectivity lenders need to navigate market volatility and scale for growth. To learn more about how Optimal Blue delivers measurable ROI, visit OptimalBlue.com.

MULTIMEDIA:

Image link for media: https://www.Send2Press.com/300dpi/26-0113-s2p-opbluedec25-300dpi.webp

Image caption: Optimal Blue’s December 2025 Market Advantage mortgage data report

NEWS SOURCE: Optimal Blue


This press release was issued on behalf of the news source (Optimal Blue), who is solely responsible for its accuracy, by Send2Press Newswire. Image, if any, was provided by the news source and not this website or the wire service. Information is believed accurate, as provided by the news source, but is not guaranteed.

To view the original story, visit: https://www.send2press.com/wire/optimal-blue-report-december-lock-volume-closes-2025-on-a-firm-footing/

Copr. © 2026 Send2Press® Newswire, Calif., USA. -- REF: S2P STORY ID: S2P132225 NOREL-3B


Consumers Grow More Deliberate in Saving as Coupon Usage Becomes a Core Shopping Behavior in 2026

SINGAPORE and NEW YORK, Jan. 12, 2026 (SEND2PRESS NEWSWIRE) — New analysis released by the HotDeals Research Team suggests that consumers are entering 2026 with a more deliberate and research-oriented approach to spending, as saving money and the use of coupons increasingly form a stable part of everyday purchasing decisions rather than occasional tactics. Based on ongoing behavioral tracking, the findings indicate that coupon usage is no longer primarily driven by short-term promotions or seasonal campaigns, but by a broader shift in price sensitivity, advance planning, and value assessment.

HotDeals
Image caption: HotDeals logo.

According to the HotDeals Research Team, insights drawn from the ongoing HotDeals Consumer Savings Index—an internal research framework built on aggregated and anonymized shopping behavior signals—show that consumers are becoming more proactive in seeking discounts before completing purchases. Rather than reacting to advertised offers, many shoppers now begin their decision-making process by comparing prices, reviewing eligibility conditions, and evaluating whether a discount meaningfully reduces total spend. This pattern suggests a structural change in how value is assessed across both essential and discretionary categories.

External research aligns with these findings. A 2026 global consumer outlook published by AlixPartners reports that a majority of consumers plan to reduce discretionary spending while placing greater emphasis on budget control and advance planning. At the same time, industry data summarized by Capital One Shopping indicates that more than nine in ten consumers have used a coupon within the past year, with digital formats accounting for the majority of usage. Together, these independent sources reinforce the observation that coupon usage is increasingly associated with intentional cost management rather than impulse-driven savings.

Additional insights from the HotDeals Deal Intelligence Report, which continuously tracks how consumers interact with discounts across multiple markets, point to a noticeable shift in purchase timing. Consumers are showing a greater willingness to delay purchases until favorable pricing conditions emerge, particularly in categories where discount cycles are predictable. This behavior reflects a growing familiarity with pricing patterns and a higher tolerance for waiting in exchange for measurable savings.

Importantly, this shift is not confined to a single demographic group. While deal-seeking behavior has often been associated with younger consumers, the data indicates that price comparison and coupon usage are now broadly distributed across age segments. The pattern appears to be driven by shared economic pressures and a heightened awareness of household cost management across generations.

In 2026, saving money is increasingly a deliberate, research-driven process rather than a reactive one. As the HotDeals Research Team ( https://www.hotdeals.com/ ) continues to monitor consumer behavior through its index and longitudinal reporting, current data suggests that coupon usage is evolving into a stable, long-term habit—shaped less by promotional intensity and more by a fundamental reassessment of value in everyday spending decisions.

NEWS SOURCE: HotDeals


This press release was issued on behalf of the news source (HotDeals), who is solely responsible for its accuracy, by Send2Press Newswire. Image, if any, was provided by the news source and not this website or the wire service. Information is believed accurate, as provided by the news source, but is not guaranteed.

To view the original story, visit: https://www.send2press.com/wire/consumers-grow-more-deliberate-in-saving-as-coupon-usage-becomes-a-core-shopping-behavior-in-2026/

Copr. © 2026 Send2Press® Newswire, Calif., USA. -- REF: S2P STORY ID: S2P132197 NOREL-3B


Food & Beverage Bounces Back with 53 New Capital Projects in November 2025

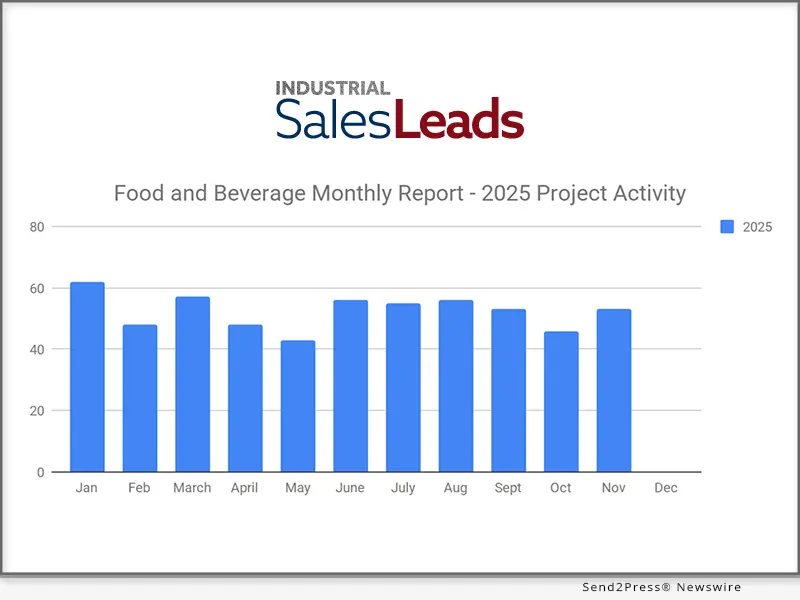
JACKSONVILLE BEACH, Fla., Dec. 18, 2025 (SEND2PRESS NEWSWIRE) — Industrial SalesLeads reported a strong rebound in the Food and Beverage industry with 53 new planned capital projects identified in November 2025. The Firm, which tracks North American industrial activity including facility expansions, new plant construction, and major equipment upgrades, confirmed the increase as part of its latest project spending report.

Food and Beverage Bounces Back with 53 New Capital Projects in November 2025
Image caption: Food and Beverage Bounces Back with 53 New Capital Projects in November 2025.

The following are selected highlights on new Food and Beverage industry construction news.

FOOD AND BEVERAGE PROJECT TYPE

  • Processing Facilities – 32 New Projects
  • Distribution and Industrial Warehouse – 25 New Projects

FOOD AND BEVERAGE PROJECT SCOPE/ACTIVITY

New Construction – 20 New Projects

Expansion – 12 New Projects

Renovations/Equipment Upgrades – 17 New Projects

Plant Closing – 6 New Projects

FOOD AND BEVERAGE PROJECT LOCATION (TOP 10 STATES)

Florida – 8

California – 5

Pennsylvania – 5

Texas – 5

Maryland – 3

South Dakota – 3

Washington – 3

Michigan – 2

Minnesota – 2

Missouri – 2

LARGEST PLANNED PROJECT

During the month of November, our research team identified 3 new Food and Beverage facility construction projects with an estimated value of $100 million or more.

The largest project is owned by Ahold Delhaize USA., who is planning to invest $860 million for the construction of a 1 million sf distribution center in BURLINGTON, NC. They are currently seeking approval for the project. Construction is expected to start in early 2026, with completion slated for 2029.

TOP 10 TRACKED FOOD AND BEVERAGE PROJECTS

SOUTH CAROLINA:

Global retail chain is planning to invest $240 million for the construction of a 900,000 sf distribution center in ROCK HILL, SC. They are currently seeking approval for the project. Construction will occur in two phases, with completion of the first phase slated for Summer 2027.

TEXAS:

Dairy products mfr. is planning to invest $200 million for the construction of a processing facility on Lou Galosy Way in LONGVIEW, TX. They are currently seeking approval for the project. Completion is slated for 2027.

FLORIDA:

Hydroponic greenhouse developer is planning to invest $66 million for the construction of a 325,000 sf growing and processing facility in NEWBERRY, FL. They have recently received approval for the project.

INDIANA:

Pet food mfr. is planning to invest $50 million for the renovation and equipment upgrades on a 100,000 sf processing facility at 601 W McKee St. in GREENSBURG, IN. They are currently seeking approval for the project.

FLORIDA:

Supermarket chain is planning to invest $35 million for a 443,000 sf expansion of their distribution and refrigerated storage facility at 9800 W. Beaver St. in JACKSONVILLE, FL. They are currently seeking approval for the project.

CALIFORNIA:

Beverage distributor is planning for the renovation of a 521,000 sf distribution facility at 15614 Shoemaker Ave. in SANTA FE SPRINGS, CA. They are currently seeking approval for the project.

NEW YORK:

Cheese mfr. is planning to invest $23 million for an expansion of their processing facilities in CAMPBELL, NY and GLENVILLE, NY. They have recently received approval for the project.

CALIFORNIA:

Winery is planning to invest $23 for the construction of a 23,500 sf production facility at 1000 Oakville Cross Rd. in NAPA, CA. They are currently seeking approval for the project.

MISSOURI:

Meat processing company is planning to invest $18 million for the renovation and equipment upgrades on a 72,000 sf processing and warehouse facility at 2000 S. Commercial St. in HARRISONVILLE, MO. They are currently seeking approval for the project. Completion is slated for 2027.

MARYLAND:

Bakery company is planning for the construction of a 176,000 sf processing facility on Bakery Way in FREDERICK, MD. They are currently seeking approval for the project.

ABOUT INDUSTRIAL SALESLEADS, INC.

Since 1959, Industrial SalesLeads, based in Jacksonville, FL is a leader in delivering industrial capital project intelligence and prospecting services for sales and marketing teams to ensure a predictable and scalable pipeline. Our Industrial Market Intelligence, IMI identifies timely insights on companies planning significant capital investments such as new construction, expansion, relocation, equipment modernization and plant closings in industrial facilities. The Outsourced Prospecting Services, an extension to your sales team, is designed to drive growth with qualified meetings and appointments for your internal sales team. Visit us at https://salesleadsinc.com/.

Each month, our team provides hundreds of industrial reports within a variety of industries, including:

Learn more:

https://www.salesleadsinc.com/blog/

https://www.salesleadsinc.com/industry/food-and-beverage/

NEWS SOURCE: Industrial SalesLeads Inc


This press release was issued on behalf of the news source (Industrial SalesLeads Inc), who is solely responsible for its accuracy, by Send2Press Newswire. Image, if any, was provided by the news source and not this website or the wire service. Information is believed accurate, as provided by the news source, but is not guaranteed.

To view the original story, visit: https://www.send2press.com/wire/food-beverage-bounces-back-with-53-new-capital-projects-in-november-2025/

Copr. © 2025 Send2Press® Newswire, Calif., USA. -- REF: S2P STORY ID: S2P131857 NOREL-3B


Optimal Blue report: Lock volume posts strongest November since 2021

Resilient refinance demand driven by current rates tempers the effects of seasonal slowdown

PLANO, Texas, Dec. 10, 2025 (SEND2PRESS NEWSWIRE) — Optimal Blue today released its November 2025 Market Advantage mortgage data report, which found that total mortgage rate-lock activity declined with normal late fall seasonality, yet still marked the strongest November in four years. Total lock volume fell 25% month over month (MoM) from October but remained up 17% year over year (YoY), buoyed by historically strong refinance demand and mortgage rates holding near 6%. Rate-and-term refinances continued to outperform 2024 levels by a wide margin, finishing November up 223% YoY despite easing from September’s high. Cash-out refinances rose 29% YoY. Purchase lock activity declined 22% MoM in line with seasonal patterns and slipped 6% YoY as elevated home costs and limited inventory continued to restrain demand.

Optimal Blue's November 2025 Market Advantage mortgage data report
Image caption: Optimal Blue’s November 2025 Market Advantage mortgage data report.

The Optimal Blue Mortgage Market Indices (OBMMI) 30-year conforming fixed rate, the benchmark for CME Group’s Mortgage Rate futures, dipped 1 basis point to 6.14% in November, marking a 53-bps improvement from the same period in 2024. FHA rates fell 5 bps to 5.99%, while VA and jumbo rates rose modestly to 5.76% (up 9 bps) and 6.44% (up 8 bps), respectively. The 10-year Treasury yield fell 11 bps to 4%, widening the mortgage rate spread by roughly 10 bps as OBMMI remained essentially flat.

“November’s data underscores a market still responding to rate relief even as seasonal patterns take hold,” said Mike Vough, senior vice president of corporate strategy at Optimal Blue. “Refinances remain the clear standout, with rate-and-term activity running more than triple last year’s levels and cash-outs continuing to outperform. It was a notably strong November by any measure.”

Lenders adjusted execution strategies in November as agency cash window sales rose 300 bps to 25%, interrupting the recent move toward greater securitization. Agency mortgage-backed securities (MBS) deliveries declined 100 bps to 45% after six consecutive months of gains, while bulk aggregator share dropped 300 bps to 27% and best-efforts executions increased 100 bps to 3%. The share of loans sold at the highest price tier fell 200 bps to 79%, while second- and fourth-tier deliveries increased. Mortgage servicing rights (MSRs) for conforming 30-year loans decreased 3 bps to 1.09% (a 4.36 multiple), in line with an average 15 bps decline across other OBMMI rate series.

“Execution strategies shifted meaningfully in November,” said Vough. “Lenders moved to the cash window as securitization momentum moderated, and pricing spreads broadened as more loans moved out of the top tier. These shifts point to lenders fine-tuning execution to manage price and overall delivery profile as the market settles into late-year conditions.”

Key findings from the Market Advantage report, derived from direct-source mortgage lock and secondary market data, include:

Volume trends and market composition

  • Refis remain a major driver: Refinances accounted for 35% of all locks. Rate-and-term refinances rose 223% YoY despite slowing from early fall peaks, while cash-out refinances increased 29% YoY.
  • Purchases decline: Purchase locks fell 22% MoM and 6% YoY as elevated home costs and limited listings continued to weigh on demand.
  • Non-QM sets new record: Non-qualified mortgage share rose to 9%, the highest level recorded by Optimal Blue, with investor/debt-service-coverage-ratio (DSCR) programs accounting for a growing share of non-QM production.
  • FHA, non-conforming pick up share: Product mix shifted toward FHA and non-conforming loans (including jumbo) at the expense of conforming and VA lending, supported in part by 5.99% FHA rates.
  • PUD share ticks up slightly: Planned unit development (PUD) lock share, a reasonable proxy for new construction, rose relative to other property types but remained well below last year’s unusually high levels.

Rates and pricing

  • Rates stabilize near 6%: The OBMMI 30-year conforming fixed rate ticked down 1 bp to 6.14%. FHA fell to 5.99%, while VA and jumbo rates rose to 5.76% and 6.44%, respectively.
  • MSR values dip: MSRs for conforming 30-year loans fell 3 bps to 1.09% (a 4.36 multiple), moving in line with rate declines.
  • Spread widens to 10-year Treasury: The 10-year Treasury yield fell 11 bps to 4%, widening the mortgage rate spread by roughly 10 bps as OBMMI remained mostly unchanged.
  • Pricing tiers show more dispersion: The share of loans sold at the highest price tier dropped 200 bps to 79%, while second- and fourth-tier shares rose.

Channel and execution

  • Cash window share increases: Cash window deliveries increased to 25% (up 300 bps) as lenders shifted execution away from aggregator and securitization outlets in November.
  • MBS share pulls back: Agency MBS sales fell to 45% (down 100 bps) after six consecutive months of increases.
  • Aggregator share declines: Bulk aggregator executions dropped to 27% (down 300 bps), while best-efforts executions rose to 3% (up 100 bps).

Product mix and borrower profiles

  • Lower-rate programs gain traction: Lenders saw greater uptake in products benefiting from improved pricing, including increased FHA share at 18.8% (up 104 bps) and steady demand for jumbo and other non-conforming offerings at 17% (up 34 bps).
  • S. buyer share rises: U.S. citizens accounted for nearly 94% of locks, extending a multi-month upward trend.
  • Credit scores and loan sizes edge lower: The average credit score fell one point to 733. The average loan amount decreased to $391,323 from October’s $397,438. November loan averages ranged from $592,129 in metro New York to $295,526 in Indianapolis. Average loan-to-value ratios ranged from 69.79% in Los Angeles to 88.22% in San Antonio.

To view the full November 2025 Market Advantage report, complete the free subscription form: https://engage.optimalblue.com/market-advantage. Subscribers receive a report PDF each month with the latest data. Members of the press are eligible for special, advance access each month and should contact Olivia DeLancey to be added to the media list.

About the Market Advantage Report

Optimal Blue issues the Market Advantage mortgage report each month to provide insight into U.S. mortgage trends and drivers of lending profitability. Data is sourced from the Optimal Blue PPE, which is used to price and lock more than one-third of all mortgages nationwide, and Optimal Blue’s hedging and loan trading system, which supports approximately 40% of loans hedged and sold into the secondary market. As the leader in mortgage capital markets technology, Optimal Blue has a direct view of both origination and secondary market activity and the interconnectedness of the two. Unlike self-reported survey data, Optimal Blue’s direct-source data accurately reflect the in-process loans in lenders’ pipelines and secondary market executions. Visit Optimal Blue’s website to subscribe to receive the free report each month.

Nothing herein shall be construed as, nor is Optimal Blue providing, any legal, trading, hedging or financial advice.

About Optimal Blue

Optimal Blue powers profitability across the mortgage capital markets ecosystem. As the industry’s only end-to-end capital markets platform, our technology, data and integrations bridge the primary and secondary markets to help lenders of all sizes maximize performance – from pricing accuracy to margin protection and every step in between. Backed by over 20 years of proven expertise, our modern, cloud-native technology delivers the real-time automation, actionable data and seamless connectivity lenders need to navigate market volatility and scale for growth. To learn more about how Optimal Blue delivers measurable ROI, visit OptimalBlue.com.

MULTIMEDIA

Image link for media: https://www.Send2Press.com/300dpi/25-1210-s2p-opbluenov-300dpi.webp

Image caption: Optimal Blue’s November 2025 Market Advantage mortgage data report

NEWS SOURCE: Optimal Blue


This press release was issued on behalf of the news source (Optimal Blue), who is solely responsible for its accuracy, by Send2Press Newswire. Image, if any, was provided by the news source and not this website or the wire service. Information is believed accurate, as provided by the news source, but is not guaranteed.

To view the original story, visit: https://www.send2press.com/wire/optimal-blue-report-lock-volume-posts-strongest-november-since-2021/

Copr. © 2025 Send2Press® Newswire, Calif., USA. -- REF: S2P STORY ID: S2P131605 NOREL-3B


November 2025 Marks Seven Straight Months of Growth with 154 New Industrial Capital Projects

Report indicates strong activity across key investment types, including new construction, expansion, renovation, and equipment upgrades

JACKSONVILLE BEACH, Fla., Dec. 4, 2025 (SEND2PRESS NEWSWIRE) — Industrial SalesLeads today announced the findings of its November 2025 report on planned capital project spending within the North American Industrial Manufacturing sector. The firm’s research, which tracks new plant construction, facility expansions, and significant equipment modernization, identified 154 new projects. Capital project activity remains stable, with 154 new projects in November, nearly matching the 155 projects tracked in October. The report indicates strong activity across key investment types, including new construction, expansion, renovation, and equipment upgrades.

November 2025 Marks Seven Straight Months of Growth with 154 New Industrial Capital Projects
Image caption: November 2025 Marks Seven Straight Months of Growth with 154 New Industrial Capital Projects.

The following are selected highlights on new Industrial Manufacturing industry construction news.

INDUSTRIAL MANUFACTURING – BY PROJECT TYPE

Manufacturing/Production Facilities – 136 New Projects

Distribution and Industrial Warehouse – 78 New Projects

INDUSTRIAL MANUFACTURING – BY PROJECT SCOPE/ACTIVITY

New Construction – 43 New Projects

Expansion – 52 New Projects

Renovations/Equipment Upgrades – 69 New Projects

Plant Closings – 13 New Projects

INDUSTRIAL MANUFACTURING – BY PROJECT LOCATION (TOP 10 STATES)

Texas – 15

Ohio – 10

California – 9

South Carolina – 9

Indiana – 8

Pennsylvania – 8

Virginia – 8

Michigan – 7

New York – 6

North Carolina – 6

Connecticut – 5

LARGEST PLANNED PROJECT

During the month of November, our research team identified 19 new Industrial Manufacturing facility construction projects with an estimated value of $100 million or more.

The largest project is owned by Eli Lilly and Company, who is planning to invest $4.5 billion for the construction of a laboratory and processing complex at 300 N. 200 W. in LEBANON, IN. They are currently seeking approval for the project.

TOP 10 TRACKED INDUSTRIAL MANUFACTURING PROJECTS

WISCONSIN:

AI technology company is planning to invest $569 million for an expansion of their manufacturing facility in MOUNT PLEASANT, WI. They are currently seeking approval for the project.

WEST VIRGINIA:

Automotive mfr. is planning to invest $453 million for the expansion and equipment upgrades on their manufacturing facility in BUFFALO, WV. They are currently seeking approval for the project. Completion is slated for 2027.

OHIO:

Automotive mfr. is planning to invest $250 million for the expansion and equipment upgrades on their manufacturing facility in PARMA, OH. They are currently seeking approval for the project.

NEW MEXICO:

Hypersonic rocket mfr. is planning to invest $235 million for the construction of a manufacturing and testing complex in RIO RANCHO, NM. They are currently seeking approval for the project.

KENTUCKY:

Automotive mfr. is planning to invest $204 million for the expansion and equipment upgrades on their manufacturing facility in GEORGETOWN, KY They are currently seeking approval for the project. Completion is slated for 2027.

TEXAS:

Communication equipment mfr. is planning to invest $150 million for the construction of a 210,000 sf manufacturing facility in SUGAR LAND, TX. They have recently received approval for the project. Completion is slated for Summer 2026.

PENNSYLVANIA:

Personal and household care product mfr. is planning to invest $142 million for the expansion and equipment upgrades on their manufacturing and warehouse facility in LEWISTOWN, PA. They have recently received approval for the project.

MISSISSIPPI:

Automotive mfr. is planning to invest $125 million for an expansion of their manufacturing facility in BLUE SPRINGS, MS. They are currently seeking approval for the project.

SOUTH CAROLINA:

Floor care appliance mfr. is planning to invest $120 million for the renovation and equipment upgrades on a manufacturing and office facility at 1000 Innovation Way in ANDERSON, SC. They have recently received approval for the project. They will consolidate their operations upon completion in Summer 2026.

NORTH CAROLINA:

Industrial concrete product mfr. is investing $102 million for the construction of a 154,000 sf manufacturing, warehouse, and office facility in GASTONIA, NC. Construction has recently started.

ABOUT INDUSTRIAL SALESLEADS, INC.

Since 1959, Industrial SalesLeads, based in Jacksonville, FL is a leader in delivering industrial capital project intelligence and prospecting services for sales and marketing teams to ensure a predictable and scalable pipeline. Our Industrial Market Intelligence, IMI identifies timely insights on companies planning significant capital investments such as new construction, expansion, relocation, equipment modernization and plant closings in industrial facilities. The Outsourced Prospecting Services, an extension to your sales team, is designed to drive growth with qualified meetings and appointments for your internal sales team. Visit us at salesleadsinc.com.

Each month, our team provides hundreds of industrial reports within a variety of industries, including:

Learn more:

https://www.salesleadsinc.com/industry/industrial-manufacturing/

https://www.salesleadsinc.com/blog/

NEWS SOURCE: Industrial SalesLeads Inc


This press release was issued on behalf of the news source (Industrial SalesLeads Inc), who is solely responsible for its accuracy, by Send2Press Newswire. Image, if any, was provided by the news source and not this website or the wire service. Information is believed accurate, as provided by the news source, but is not guaranteed.

To view the original story, visit: https://www.send2press.com/wire/november-2025-marks-seven-straight-months-of-growth-with-154-new-industrial-capital-projects/

Copr. © 2025 Send2Press® Newswire, Calif., USA. -- REF: S2P STORY ID: S2P131460 NOREL-3B


iEmergent’s latest U.S. mortgage forecast validation confirms industry-leading accuracy

New analysis shows iEmergent's mortgage origination projections outperforming other publicly available forecasts over a six-year period

DES MOINES, Iowa, Dec. 2, 2025 (SEND2PRESS NEWSWIRE) — iEmergent, a forecasting and advisory services firm for the financial services, mortgage and real estate industries, released a new analysis validating that its U.S. purchase mortgage origination forecasts continue to lead the industry in accuracy, outperforming other publicly available forecasts such as those published by Fannie Mae and the Mortgage Bankers Association (MBA) over the last six years.

6-YR COMPARISON OF iEMERGENT'S 'NEXT YEAR'S' FORECAST ACCURACY VS. MBA, FANNIE MAE
Image caption: [1] 6-YR COMPARISON OF iEMERGENT’S ‘NEXT YEAR’S’ FORECAST ACCURACY VS. MBA, FANNIE MAE.

6-YR COMPARISON OF iEMERGENT'S 'LAST ESTIMATE' FORECAST ACCURACY VS. MBA, FANNIE MAE
Image caption: [2] 6-YR COMPARISON OF iEMERGENT’S ‘LAST ESTIMATE’ FORECAST ACCURACY VS. MBA, FANNIE MAE.

iEmergent’s forecasting approach centers on the Purchase Mortgage Generation Rate (PMGR), a proprietary metric that represents the rate at which a defined market produces purchase mortgages. The PMGR simplifies forecasting by capturing the complexity of the U.S. mortgage market, including economic and demographic factors, homebuyer behavior and decades of Home Mortgage Disclosure Act (HMDA) loan data. When paired with a demand-driven view of the homebuyer pool, this bottom-up model—which can be applied at any geographic level from the individual census tract to the entire nation—delivers reliable insight into where and when mortgage activity will emerge.

For the six-year period spanning 2019 to 2024, iEmergent achieved a 9.5% mean absolute percent error (MAPE) for ‘next year’s’ forecasts (projections issued a year in advance) and a 3.9% MAPE for ‘last estimate’ forecasts (projections released a few months ahead of HMDA’s annual release of actual loan counts). And over the past three years (2022–2024), iEmergent’s forecast accuracy has improved even further, achieving an 8.4% MAPE for ‘next year’s’ forecasts and a 1.2% MAPE for ‘last estimate’ forecasts.

“These results demonstrate the strength of iEmergent’s proprietary forecasting model and why our approach consistently leads the industry in accuracy,” iEmergent COO Bernard Nossuli said. “Lenders need a dependable way to see where mortgage opportunity will take shape, and iEmergent’s model gives them that insight well before traditional indicators emerge.”

iEmergent’s purchase mortgage forecast accuracy remains high even when projections are segmented by borrower race and ethnicity. The company also delivers strong refi mortgage forecast accuracy, maintaining an error rate in the 2% range despite growing refinance market volatility.

For a closer look at iEmergent’s novel and highly accurate approach to forecasting U.S. mortgage originations, read the company’s methodology blog post.

About iEmergent

Founded in 2000, iEmergent provides mortgage lending forecasts and analytics to the lending, housing and real estate industries. The company offers an extensive variety of forecast and market intelligence products, including Mortgage MarketSmart, a visualization tool that helps lenders quantify how mortgage markets will change. For more information, visit https://www.iemergent.com/.

Tags: @iEmergent #mortgagelending #mortgage #origination #housingdata

Media Kit:
https://www.iemergent.com/docs/default-source/default-document-library/presskit_digitallinked.pdf

NEWS SOURCE: iEmergent


This press release was issued on behalf of the news source (iEmergent), who is solely responsible for its accuracy, by Send2Press Newswire. Image, if any, was provided by the news source and not this website or the wire service. Information is believed accurate, as provided by the news source, but is not guaranteed.

To view the original story, visit: https://www.send2press.com/wire/iemergents-latest-u-s-mortgage-forecast-validation-confirms-industry-leading-accuracy/

Copr. © 2025 Send2Press® Newswire, Calif., USA. -- REF: S2P STORY ID: S2P131391 NOREL-3B


BOOKS TO BOOKMARK List for Q2-Q3 2025 Highlights 13 Fascinating New Books Worth a Look That You’ve Never Heard Of

Great new books for gift giving, holiday travel unwinding and general self-help

TEMECULA, Calif., Nov. 24, 2025 (SEND2PRESS NEWSWIRE) — Publishers Newswire (PNW), an online news publisher covering books, music, indie film, and software launched in 2004, today announced its latest semi-annual “books to bookmark” list for Q2 and Q3 (April through September) 2025, noting 13 new and interesting “good reads” from small publishers released this year. These newly published books are often overlooked due to not coming from major traditional book publishers.

BOOKS TO BOOKMARK List for Q2-Q3 2025 Highlights 13 Fascinating New Books Worth a Look
Image caption: BOOKS TO BOOKMARK List for Q2-Q3 2025 Highlights 13 Fascinating New Books Worth a Look.

“One of the interesting trends this year has been the resurgence of memoirs and business self-help books,” says PNW editor and publisher, Christopher Laird Simmons, who has worked in the publishing world since the late ‘70s, and is also CEO of the website’s parent company, NEOTROPE.

13 BOOKS WORTH A LOOK FOR Q2-Q3 2025:

(alphabetical order by book title)

:: AN ALZHEIMER’S CAREGIVER ALPHABET AND MORE…

New illustrated book offers artful, honest reflection on caregiving and loss. Chuck Pennington’s “An Alzheimer’s Caregiver Alphabet And More…” is a deeply personal, beautifully illustrated book offering both solace and insight to those touched by the devastating realities of dementia. This unique collection pairs watercolor artwork by Nick Mijak with poignant reflections from Pennington, who tenderly chronicles his journey as a caregiver for his late partner, Dennis.

:: CHANGING THE WORLD… THROUGH SMALL BUSINESS STEWARDSHIP

New book seeks to spark global movement of small business stewards. In a world captivated by billion-dollar headlines and corporate giants, a new book turns the spotlight to the real engines of economic and social change: small business owners. Bestselling author David Grau Sr., JD, launches his newest and most important work, “Changing the World… Through Small Business Stewardship.”

:: I RISE, A SURVIVOR I STAND

New memoir offers hope, healing, and strength for victims of gender-based violence. Author Traci L Woodcock courageously shares her new book, “I Rise, A Survivor I Stand” which is an empowering story of resilience and survival through the darkest moments of domestic abuse, stalking, and assault. This gripping memoir is not just a recounting of trauma but a testament to the human spirit’s capacity to rise from the ashes, providing a beacon of hope for others facing similar challenges.

:: ON CONTEMPLATING GOD THE TRINITY: A COLLECTION OF POEMS

Annette R Allen’s debut volume explores the mystery, majesty, and love of God through poetry. She asks: What if poetry could open a window into the mystery of God Himself? In “On Contemplating God the Trinity: A Collection of Poems” Australian poet Annette R. Allen invites readers on a lyrical journey into the heart of the Christian faith, exploring the majesty of creation, the wonder of the Trinity, and the love of Christ that changes everything.

:: PERSONALITY INTELLIGENCE: MASTER THE ART OF BEING YOU (FOR YOUR SAKE AND EVERYONE ELSE’S)

New book by Merrick Rosenberg unlocks the power of personality to transform work, relationships, and life. After helping more than 15 million people worldwide discover their personality style, Rosenberg – entrepreneur, keynote speaker, and the creative force behind the popular “bird” framework of personality – announces the release of his groundbreaking new book, “Personality Intelligence: Master the Art of Being You (For Your Sake and Everyone Else’s).”

:: RIGGED: THE MISADVENTURES OF A CLASSIC WOODEN SAILBOAT

Tony Cond, a retired Royal Canadian Navy Marine Systems Engineer and lifelong sailor, shares a collection of personal stories in his new book, “Rigged: The Misadventures of a Classic Wooden Sailboat.” The book captures decades of misadventures, quiet triumphs, and family traditions centered around a classic 1947 wooden boat named Rufus.

:: SPECIAL OPERATIONS GROUP

Author Christophe Glasl returns with the unflinching memoir of life inside Australia’s elite police unit. After years of silence, former Victoria Police officer Christophe Glasl is reclaiming his story. His memoir, “Special Operations Group” is once again available to readers, offering a raw, unfiltered look inside one of Australia’s most secretive law enforcement units.

:: TAKE THIS PHONE AND SHOVE IT! – A FRUSTRATED SENIOR’S GUIDE TO SMARTPHONES

Senior tech educator and author Anne Goldberg tackles smartphone frustration in new book. Seniors frustrated with their smartphones finally have a guide written just for them. Anne Goldberg, a 73-year-old tech educator and founder of Savvy Senior Tech LLC, announces the release of her highly anticipated book, “Take This Phone and Shove It!”

:: THE CRISIS CASEBOOK: LESSONS IN CRISIS MANAGEMENT FROM THE WORLD’S LEADING BRANDS

New book from author Edward Segal, “The Crisis Casebook,” reveals how the world’s leading brands navigate disasters and scandals. Crisis management expert Edward Segal offers a timely roadmap for organizations, leaders, and public figures who want to be prepared for the inevitable.

:: THE LIGHT RUNNER

Actress and author Ally Walker, star of “Sons of Anarchy,” debuts new metaphysical thriller “The Light Runner.” Her versatility has made her a standout presence in film and television, with memorable performances and she brings her experiences fully into the crafting of this new novel.

:: THE LOGIC OF PSYCHOLOGY: OF SCIENCE AT LARGE, AND EVERYDAY LIFE

“The Logic of Psychology” (2nd Edition) by Peter McQuaig delivers a “bold new framework” for understanding human psychology and its place within science.

:: THE OTHER MOZART: THE MAGIC FLUTE – AN OPERA TO DIE FOR!

The truth behind Mozart’s death: fact or fiction? Was Mozart murdered because of a dangerous secret? A shocking new novel by Dr. Martin W. B. Jarvis, “The Other Mozart: The Magic Flute – An Opera to Die For!” raises bold questions about one of history’s greatest composers – and whether his genius might not have been entirely his own.

:: WEDDING PLANNING: FIVE EASY STEPS & THE SECRET TO PULL IT TOGETHER

In new book, author Kathy Forbes makes wedding planning easy, organized, and joyful. Forbes, a certified wedding and event planner with decades of experience, announces the release of her practical and refreshingly candid guidebook, “Wedding Planning: Five Easy Steps & The Secret to Pull it Together.” This indispensable wedding guide is designed to help couples plan with confidence, stay organized, and genuinely enjoy their big day – without getting overwhelmed.

LEARN MORE:

To learn more about these and other great reads you’ve never heard about, visit:

https://publishersnewswire.com/book-news/

ABOUT PUBLISHERS NEWSWIRE:

Publishers Newswire™ is an online publication founded in 2004, part of the Neotrope News Network, covering books and publishing, music and software news. Publishers Newswire does not endorse, “recommend,” or review any of the book titles mentioned, and the specific books mentioned are for informational purpose only. No fee or other consideration was paid for inclusion in this list.

ABOUT NEOTROPE:

Neotrope® has been in the publishing business since the late 1970s, when then teenage founder Christopher Simmons published first “The Comic Collectors Comic Checklist” sold at the San Diego Comic-Con. The company went on to publish “The Galaxy of Fandom” a two-issue entertainment magazine, and later “The Adama Journal” a fanzine for “Battlestar Galactica.” In 1982, “The Unicorn Hunters Guidebook” was featured in Playboy magazine. In 1987, a fanzine for “Star Trek: The Next Generation” called “Galaxy Class” launched. In 2008, the company published “FRACTOPIA” a coffee table art book by Simmons (ISBN: 978-0971055506; Neotrope Press).

The company publishing unit was originally called Silver Unicorn Graphics (S.U. Graphics and Marketing), became Mindset Press in 1987 and Neotrope Press in 1997. The Neotrope News Network was launched in 2004.

The company is also a leader in online advertising and marketing, public relations, music/video and multimedia. Neotrope is based in the Southern California wine country of Temecula. Neotrope® is a registered trademark in the U.S. and Europe. The company celebrated its 40th anniversary Jan. 2023.

Christopher Simmons has been a working journalist since 1984 when he sold his first article to POLYPHONY magazine. Later writing for diverse pubs including Computer Player, Digital Imaging, Micro Publishing News, Spazz, the Graphic Artist’s Guild newspaper, among many others. He has been widely interviewed on topics related to technology, marketing, health and entertainment.

Learn more about Neotrope at: https://neotrope.com/ (website under reconstruction).

NOTE: NEOTROPE does not publish any of the “books to bookmark” mentioned in this press release nor represent any author or publisher in an agency capacity. For questions about any of the books mentioned contact the author or publisher directly and not this website.

NEWS SOURCE: Publishers Newswire


This press release was issued on behalf of the news source (Publishers Newswire), who is solely responsible for its accuracy, by Send2Press Newswire. Image, if any, was provided by the news source and not this website or the wire service. Information is believed accurate, as provided by the news source, but is not guaranteed.

To view the original story, visit: https://www.send2press.com/wire/books-to-bookmark-list-for-q2-q3-2025-highlights-13-fascinating-new-books-worth-a-look-that-youve-never-heard-of/

Copr. © 2025 Send2Press® Newswire, Calif., USA. -- REF: S2P STORY ID: S2P131300 NOREL-3B


ACES Q2 2025 Mortgage QC Industry Trends Report shows modest rise in critical defect rate as refinance complexity tests loan quality

Collateral, eligibility and regulatory defects rise as cash-out refinances grow; core underwriting quality continues to strengthen

DENVER, Colo., Nov. 18, 2025 (SEND2PRESS NEWSWIRE) — ACES Quality Management® (ACES), the leading provider of enterprise quality management and control software for the financial services industry, today announced the release of its quarterly ACES Mortgage QC Industry Trends Report covering the second quarter (Q2) of 2025. The report analyzes post-closing quality control data derived from the ACES Quality Management & Control® software.

ACES Quality Management
Image caption: ACES Quality Management®.

Key findings from the Q2 2025 ACES Mortgage QC Industry Trends Report include:

  • The overall critical defect rate increased 15.27%, rising from 1.31% in Q1 2025 to 1.51%.
  • Appraisal defects surged 156.5%, while Borrower/Mortgage Eligibility defects more than doubled to 15.87%.
  • Income/Employment defects improved 19.7%, falling from 22.99% to 18.45% of all critical defects.
  • Loan Documentation and Insurance defects declined 32.6% and 25.2%, respectively.
  • Purchase defect share decreased to 73.96%, while refinance defect share climbed to 26.04% amid increased cash-out activity.
  • Conventional loan quality improved, while FHA and VA findings rose modestly.

“Although the overall critical defect rate increased for a second straight quarter, the situation is nuanced,” said Nick Volpe, executive vice president at ACES Quality Management. “The rise was mainly in specific categories such as appraisals and eligibility-related areas. Meanwhile, other key underwriting areas saw notable improvements. This mixed performance demonstrates the importance of continuous monitoring and targeted quality control efforts.”

Findings for the Q2 2025 ACES Mortgage QC Industry Trends Report are based on post-closing quality control data derived from the ACES Quality Management and Control® benchmarking system and incorporate data from prior quarters and/or calendar years, where applicable. All reviews and defect data evaluated for the report were based on loan audits selected by lenders for full file reviews. The Mortgage QC Industry Trends Reports are available for download, free of charge, at https://www.acesquality.com/resources/reports.

About ACES Quality Management

ACES Quality Management is the leading provider of enterprise quality management and control software for the financial services industry. The nation’s most prominent lenders, servicers and financial institutions rely on ACES Quality Management & Control® Software to improve audit throughput and quality while controlling costs, including:

  • Over 70% of the top 20 independent mortgage lenders;
  • 7 of the top 10 loan servicers;
  • 11 of the top 30 banks; and
  • 3 of the top 5 credit unions in the United States.

Unlike other quality control platforms, ACES Flexible Audit Technology® enables independent mortgage lenders and financial institutions to easily manage and customize the system to their specific needs without relying on IT or outside resources. With ACES’ AI-powered capabilities, audit teams can translate complexity into clear insights and accelerate performance. Using a customer-centric approach, ACES clients get responsive support and access to our experts to maximize their investment. For more information, visit www.acesquality.com or call 1-800-858-1598.

NEWS SOURCE: ACES Quality Management


This press release was issued on behalf of the news source (ACES Quality Management), who is solely responsible for its accuracy, by Send2Press Newswire. Image, if any, was provided by the news source and not this website or the wire service. Information is believed accurate, as provided by the news source, but is not guaranteed.

To view the original story, visit: https://www.send2press.com/wire/aces-q2-2025-mortgage-qc-industry-trends-report-shows-modest-rise-in-critical-defect-rate-as-refinance-complexity-tests-loan-quality/

Copr. © 2025 Send2Press® Newswire, Calif., USA. -- REF: S2P STORY ID: S2P131127 NOREL-3B


Optimal Blue report: October lock volume holds second-highest level in three years

Seasonal cooling offset by resilient refinance demand and rising agency MBS executions

PLANO, Texas, Nov. 11, 2025 (SEND2PRESS NEWSWIRE) — Optimal Blue today released its October 2025 Market Advantage mortgage data report, showing that rate-lock activity remained strong despite seasonal cooling and continued to outpace last year’s levels. Total lock volume fell 4.2% month over month (MoM) from September’s peak but was still up 18% year over year (YoY) as borrowers responded to improving affordability and narrower rate spreads.

Optimal Blue's October 2025 Market Advantage mortgage data report.
Image caption: Optimal Blue’s October 2025 Market Advantage mortgage data report.

Purchase locks declined just 1.5% in October, in line with typical seasonal patterns, while refinance lending remained a key driver of activity. Rate-and-term refinances fell 14% from September but stayed up 143% YoY, and cash-out refinances rose 6% MoM and 29% YoY.

The Optimal Blue Mortgage Market Indices (OBMMI) 30-year conforming fixed rate – the benchmark for CME Group’s Mortgage Rate futures – dropped another 16 basis points (bps) to 6.16%, marking its lowest level since late 2023.

“October’s data speaks to the market’s resilience,” said Mike Vough, head of corporate strategy at Optimal Blue. “Purchase activity held steady and refinance demand – particularly cash-outs – remained strong. Even after September’s record pace, October delivered another standout month for originations.”

Lenders continued to strengthen execution strategies in the secondary market during October. Sales to agency mortgage-backed securities (MBS) climbed 400 bps to 46%, extending a multi-month trend of large-lender securitization growth. Deliveries to the agency cash window fell 200 bps to 30%, while aggregator bulk and best-efforts channels each dipped 100 bps. The share of loans sold at the highest price tier rose to 81%, up 300 bps, underscoring lenders’ ability to capture premium pricing even as servicing values tightened. Mortgage servicing rights (MSRs) for conforming 30-year loans increased 3 bps to 1.12% (a 4.47 multiple), moving in line with an average 6-bps gain across OBMMI rates for the month.

“October’s secondary market data reflected clear strength in execution,” said Vough. “Lenders leaned further into MBS sales and maintained access to top-tier pricing, signaling disciplined hedging and growing investor confidence. With securitization share and pricing quality both on the rise, large lenders appear well positioned to sustain profitability as production remains steady.”

Key findings from the Market Advantage report, derived from direct-source mortgage lock and secondary market data, include:

VOLUME TRENDS AND MARKET COMPOSITION

  • Refis stay elevated: Rate-and-term refinances fell 14% MoM but remained up 143% YoY, while cash-outs rose 6% MoM and 29% YoY. Refinance pull-through improved to 71.6%, up 11.4 points from September. Refinances accounted for 37% of all production in October, down 176 bps from September but up 11.4 points YoY.
  • Purchases steady: Purchase locks declined 1.5% aligned to seasonal expectations, remaining strong relative to historical patterns. Purchase pull-through improved to 84.6%, up 91 bps from September.
  • Non-QM share rises: Non-qualified mortgage share edged higher, driven by gains in both investor/debt-service-coverage-ratio (DSCR) and bank statement programs.
  • FHA and conforming gain share: FHA and conforming production increased at the expense of primarily VA lending. VA refinance activity typically reacts fastest to rate reductions, leading to a front-loading of VA locks in September.
  • Single-family share climbs: Single-family production rose relative to all other property types in October, reflecting sustained strength in owner-occupied lending.

RATES AND PRICING

  • Mortgage rates decline: The OBMMI 30-year conforming fixed rate fell 16 bps to 6.16%, with FHA at 6.04%, VA at 5.67% and jumbo at 6.36%.
  • Spread tightens to 10-year: The mortgage rate spread to the 10-year Treasury narrowed 11 bps to just over 200 bps, down 46 bps from 2024 and the tightest since early 2022. The 10-year yield itself fell only 5 bps to 4.11% as the Fed’s recent rate cut was largely priced into the market, indicating that most of the mortgage rate improvement stemmed from spread compression rather than a broader interest rate decline.
  • Lender pricing strengthens: Lenders achieved higher overall pricing levels in October as spreads narrowed and execution improved across delivery channels.
  • Servicing values recover: MSRs for conforming 30-year loans rose 3 bps to 1.12% (a 4.47 multiple).

CHANNEL AND EXECUTION

  • Agency MBS execution expands: Share rose to 46% (+400 bps), while the agency cash window share of execution fell to 30% (–200 bps) and aggregator bulk and best efforts each dipped 100 bps.
  • Investor count steady: The average number of active investors held at 11, reflecting stable liquidity conditions. Historical counts ranged from 8 in November 2024 to 12 in December 2024.
  • Higher-tier pricing dominates: With 81% of loans sold at the highest pricing tier, lenders demonstrated disciplined execution strategies that offset margin pressure from rate compression.

PRODUCT MIX AND BORROWER PROFILES

  • DTIs and affordability flat: Debt-to-income ratios and first-time homebuyer share held steady, signaling sideways affordability movement.
  • Balanced composition: FHA and conforming production growth offset earlier VA surge, keeping overall mix diverse across loan types.
  • Credit profiles, loan amounts dip: The average credit score fell to 734 from 735 MoM. The average loan amount decreased to $397,438 from $403,746. October loan averages ranged from $602,646 in metro New York to $312,177 in Indianapolis. Average loan-to-value (LTV) ratios ranged from 70% in San Francisco to 87% in San Antonio.

To view the full October 2025 Market Advantage report, complete the free subscription form: https://engage.optimalblue.com/market-advantage. Subscribers receive a report PDF each month with the latest data. Members of the press are eligible for special, advance access each month and should contact Olivia DeLancey to be added to the media list.

Access this month’s podcast episode: https://market-advantage.captivate.fm/episode/episode-14.

ABOUT THE MARKET ADVANTAGE REPORT

Optimal Blue issues the Market Advantage mortgage report each month to provide insight into U.S. mortgage trends and drivers of lending profitability. Data is sourced from the Optimal Blue PPE, which is used to price and lock more than one-third of all mortgages nationwide, and Optimal Blue’s hedging and loan trading system, which supports approximately 40% of loans hedged and sold into the secondary market. As the leader in mortgage capital markets technology, Optimal Blue has a direct view of both origination and secondary market activity and the interconnectedness of the two. Unlike self-reported survey data, Optimal Blue’s direct-source data accurately reflect the in-process loans in lenders’ pipelines and secondary market executions. Visit Optimal Blue’s website to subscribe to receive the free report each month.

Nothing herein shall be construed as, nor is Optimal Blue providing, any legal, trading, hedging or financial advice.

ABOUT OPTIMAL BLUE

Optimal Blue powers profitability across the mortgage capital markets ecosystem. As the industry’s only end-to-end capital markets platform, our technology, data, and integrations bridge the primary and secondary markets to help lenders of all sizes maximize performance – from pricing transparency and accuracy to pipeline risk management and every step in between. Backed by over 20 years of proven expertise, our modern, cloud-native technology delivers the real-time automation, actionable data, and seamless connectivity lenders need to navigate market volatility and scale for growth. To learn more about how Optimal Blue delivers measurable ROI, visit https://OptimalBlue.com/.

MULTIMEDIA

Image link for media: https://www.Send2Press.com/300dpi/25-1111-s2p-opblueoct-300dpi.webp

Image caption: Optimal Blue’s October 2025 Market Advantage mortgage data report.

NEWS SOURCE: Optimal Blue


This press release was issued on behalf of the news source (Optimal Blue), who is solely responsible for its accuracy, by Send2Press Newswire. Image, if any, was provided by the news source and not this website or the wire service. Information is believed accurate, as provided by the news source, but is not guaranteed.

To view the original story, visit: https://www.send2press.com/wire/optimal-blue-report-october-lock-volume-holds-second-highest-level-in-three-years/

Copr. © 2025 Send2Press® Newswire, Calif., USA. -- REF: S2P STORY ID: S2P130911 NOREL-3B


Q4 2025 Begins with Over 6% Surge – 5 Straight Months of Steady Growth for New Industrial Manufacturing Planned Projects

The strong start to Q4 reflects sustained and continued investment in the industrial manufacturing sector

JACKSONVILLE BEACH, Fla., Nov. 5, 2025 (SEND2PRESS NEWSWIRE) — Industrial SalesLeads announced today the October 2025 results from its latest report on new planned capital project spending within the Industrial Manufacturing industry. The firm tracks North American industrial capital project activity, including facility expansions, new plant construction, and significant equipment modernization initiatives. October results reveal 155 new projects, up from 146 in September, 143 in August, and 141 in both June and July, marking five consecutive months of steady growth with a total increase of 9.93%. The strong start to Q4 reflects sustained and continued investment in the industrial manufacturing sector.

Q4 2025 Begins with Over 6% Surge - 5 Straight Months of Steady Growth for New Industrial Manufacturing Planned Projects
Image caption: Q4 2025 Begins with Over 6% Surge – 5 Straight Months of Steady Growth for New Industrial Manufacturing Planned Projects.

The following are selected highlights on new Industrial Manufacturing industry construction news.

INDUSTRIAL MANUFACTURING – BY PROJECT TYPE

Manufacturing/Production Facilities – 131 New Projects

Distribution and Industrial Warehouse – 73 New Projects

INDUSTRIAL MANUFACTURING – BY PROJECT SCOPE/ACTIVITY

New Construction – 41 New Projects

Expansion – 50 New Projects

Renovations/Equipment Upgrades – 66 New Projects

Plant Closings – 17 New Projects

INDUSTRIAL MANUFACTURING – BY PROJECT LOCATION (TOP 10 STATES)

North Carolina – 13

Ohio – 11

Pennsylvania – 11

Indiana – 10

Florida – 9

Texas – 9

California – 8-

Georgia – 7

Michigan – 7

New York – 7

South Carolina – 7

LARGEST PLANNED PROJECT

During the month of October, our research team identified 18 new Industrial Manufacturing facility construction projects with an estimated value of $100 million or more.

The largest project is owned by AstraZeneca, who is investing $4.5 billion for the construction of a processing campus in ALBEMARLE COUNTY, VA. Completion is slated for 2029.

TOP 10 TRACKED INDUSTRIAL MANUFACTURING PROJECTS

LOUISIANA:

Startup pig iron mfr. is planning to invest $3 billion for the construction of a manufacturing facility in DONALDSONVILLE, LA. They are currently seeking approval for the project. Construction is expected to start in late 2027, with completion slated for 2030.

ILLINOIS:

Automotive mfr. is planning to invest $600 million for the renovation and equipment upgrades on their manufacturing facility in BELVIDERE, IL. They are currently seeking approval for the project. Completion is slated for 2027.

WYOMING:

Defense contractor is planning to invest $500 million for the construction of a processing facility in GILLETTE, WY. They are currently seeking approval for the project. Construction is expected to start in 2027, with completion slated for early 2031.

LOUISIANA:

Technology company is planning to invest $370 million for the construction of a 40,000 sf manufacturing facility in RUSTON, LA. They are currently seeking approval for the project. Construction is expected to start in Spring 2026, with completion slated for Summer 2027.

PENNSYLVANIA:

Battery storage equipment mfr. is planning to invest $353 million for equipment upgrades on a 432,000 sf manufacturing facility in MARSHALL TOWNSHIP, PA. The project includes the renovation of 40,000 sf of office space at 100 S Commons in PITTSBURGH, PA. They will relocate their corporate HQ operations upon completion.

MASSACHUSETTS:

Medical equipment mfr. is planning to invest $300 million for the renovation and equipment upgrades on a 500,000 sf manufacturing and office facility at 188 Assembly Park Dr. in SOMERVILLE, MA. They are currently seeking approval for the project and will relocate their operations upon completion.

OHIO:

Home appliance mfr. is planning to invest $300 million for the expansion of their manufacturing facilities in CLYDE, OH and MARION, OH. They are currently seeking approval for the project.

FLORIDA:

Pharmaceutical company is planning to invest $250 million for the construction of a 70,000 sf processing facility in CORAL SPRINGS, FL. They are currently seeking approval for the project.

MINNESOTA:

Aerospace company is planning to invest $192 million for the construction of a manufacturing, office, research, and testing complex in ROSEMOUNT, MN. They are currently seeking approval for the project.

TEXAS:

Medical device mfr. is planning to invest $186 million for the expansion, renovations, and equipment upgrades on their manufacturing facility in FORT WORTH, TX. They are currently seeking approval for the project.

ABOUT INDUSTRIAL SALESLEADS, INC.

Since 1959, Industrial SalesLeads, based in Jacksonville, FL is a leader in delivering industrial capital project intelligence and prospecting services for sales and marketing teams to ensure a predictable and scalable pipeline. Our Industrial Market Intelligence, IMI identifies timely insights on companies planning significant capital investments such as new construction, expansion, relocation, equipment modernization and plant closings in industrial facilities. The Outsourced Prospecting Services, an extension to your sales team, is designed to drive growth with qualified meetings and appointments for your internal sales team. Visit us at https://salesleadsinc.com/.

Each month, our team provides hundreds of industrial reports within a variety of industries, including:

LEARN MORE:

https://www.salesleadsinc.com/industry/industrial-manufacturing/

https://www.salesleadsinc.com/blog/

NEWS SOURCE: Industrial SalesLeads Inc


This press release was issued on behalf of the news source (Industrial SalesLeads Inc), who is solely responsible for its accuracy, by Send2Press Newswire. Image, if any, was provided by the news source and not this website or the wire service. Information is believed accurate, as provided by the news source, but is not guaranteed.

To view the original story, visit: https://www.send2press.com/wire/q4-2025-begins-with-over-6-surge-5-straight-months-of-steady-growth-for-new-industrial-manufacturing-planned-projects/

Copr. © 2025 Send2Press® Newswire, Calif., USA. -- REF: S2P STORY ID: S2P130754 NOREL-3B


The Pantheory Research Organization is announcing its latest scientific research and related scientific journal-published papers and related information

CERRITOS, Calif., Oct. 23, 2025 (SEND2PRESS NEWSWIRE) — The Pantheory Research Organization is announcing its latest scientific research and related scientific journal-published papers and related information. Our organization: The Pantheory Research Organization is the author of all the research papers to be discussed here.

Pantheory Research Organizaton: James Webb space telescope can look farther into the most distant universe
Image caption: Image Caption: The James Webb space telescope (JWST) can look farther into the most distant universe than any other visual telescope.

The link that explains this organization’s detail is here: https://www.send2press.com/wire/profile/pantheory-research-organization/

The listing of all of our papers over the last two decades is posted on the online Research discussion organization’s website called ResearchGate, shown in the link here: https://www.researchgate.net/profile/Forrest-Noble

The JWST was “functionally confirmed” and the first release of its deep-field photos was in July of 2022. Since that time its most distant observations have continuously contradicted Big Bang cosmology in nearly all of its predictions of deep-field observations. What they saw instead was almost the opposite of what they had predicted. On the other hand, our prior research predictions which were made before the James Webb’s first photos were released have been continuously confirmed by JWST observations based upon our alternative cosmology, the Pan Theory. This is extremely important because neither mainstream cosmology nor any other alternative cosmology has made this many predictions concerning the distant universe that have never been contradicted or required any ad hoc hypotheses.

https://www.researchgate.net/publication/370201870_Surprising_and_Unexpected_Discoveries_the_James_Webb_Space_Telescope_Will_Likely_Make_Based_Upon_Our_Research#fullTextFileContent

Since the paper above, we have written two new research papers. The first describes all of the generally well-known Problems and contradictions of mainstream cosmology, which also includes what we believe to be relatively simple answers to these mainstream recognized Big Bang (BB) problems based upon our alternative cosmology the Pan Theory.

Roughly a general conclusion of this first paper is that the past universe looks the same as the local universe because the past universe would be much older than mainstream cosmology could allow, a conclusion sometimes mentioned concerning possibilities concerning such “either or” discussions concerning how old-looking some distant galaxies appear to be.

WHAT IS THE PURPOSE OF THIS PRESS RELEASE?

That the past research paper shown above correctly predicted the future observations of the James Webb, almost completely contrary to mainstream predictions, should draw the reader’s great attention to the basis for these predictions which was the alternative cosmology, the Pan Theory, link below. It also describes our two newest research papers explained below. This combined research presents a much simpler alternative cosmology, one without dark matter, dark energy, without a cosmological constant, Inflation, the expansion of space, etc. The Pan Theory of cosmology has no ad hoc hypotheses within it and has never been contradicted since its conception and presentation more than five decades ago.

https://www.pantheory.org/

Although this cosmology leans somewhat toward a Steady-State like cosmology of a much older universe, the biggest mainstream problem with an older universe is that it contradicts the Hubble Distance formula. Regardless of the redshift and the Hubble constant being considered, the universe according to the Hubble distance formula has an age limit to it thought to be no greater than 16 billion years of age. Another major difference between the two theories is that The Pan theory also proposes that the observable universe as a whole is generally not evolving and that it has no infinities or continuums within it.

The Pan Theory also contradicts the most well-known steady state theories of Hoyle et. al. in that the observable universe: is not expanding, is much older than currently thought, but not infinite in age or size. It accordingly is limited in its quantity of matter, had a beginning to it, and space (without field) can be simply defined as the distance between matter and the volume that the Zero Point Field occupies, no more than this.

To explain away a number of the JWST problems, many mainstream scientists now believe that the universe could have evolved very quickly, “almost instantaneously” (in situ) which we believe is an even bigger stretch of theory because astronomers have a mountain of evidence to explain the minimum time it takes galaxies and supernovae to form and evolve. To explain it differently now would require that the laws of astronomy and physics were very different in the past, which would be another big cosmology problem that would require another big un-testable ad hoc hypothesis to mainstream cosmology.

These new problems, as well as all the other acknowledged Big Bang (BB) problems since the James Webb went up, are “explained-away” by generally simple answers to all of the BB problems based upon our alternative, much simpler cosmology, the Pan Theory.

https://www.researchgate.net/publication/370212804_Relatively_simple_answers_to_almost_all_the_Well-Known_and_Lesser-Known_Problems_of_Mainstream_Cosmology

However, based solely upon a much older universe, roughly one-fourth of the most distant galactic observations cannot simply be explained. In this case what would the contradictions to both mainstream cosmology and to steady state theories in general be?

What our second and most resent research paper offers are generally unknown theoretical physics equations which are based upon our alternative cosmology, The Pan Theory. We believe this paper explains away all the remaining cosmological problems discussed by a dilation process.

This paper is called “A Complete Scale Relativity Theory proposing a fractal character to the Universe which is not based upon the warping of spacetime or extra-dimensions.” As did our previous supernovae calculation paper, this new research also explains the non-existence of dark energy based upon an alternative distance equation that does not require a Hubble constant, a version of which was presented in our original paper now 12 years old.

This paper, link below, instead is based upon a little-known theory of relativity which we call the Pan Theory of Relativity, which itself is part of the Pan Theory.

https://www.researchgate.net/publication/387180207_A_Complete_Scale_Relativity_Theory_proposing_a_Fractal_character_of_the_Universe_not_based_upon_the_warping_of_spacetime_or_extra-_dimensions_It_is_the_Result_of_our_second_data-research_study_of_type#fullTextFileContent

This theory of relativity is much simpler than Einstein’s relativity theories. Although it does not replace either of them or change their equations, it renders both of them lees important concerning the overall picture of reality and of the universe.

Concerning relativity theory and the dilation of time (where the length of a second gets longer), Special Relativity refers to special cases where velocities approach the speed of light, and General Relativity refers to the small effects of gravity on the dilation of time. Instead this theory of relativity is assertively much more important in that respect. It states that time itself is not a continuum but dilates (the interval of a second of time gets longer) when looking backward in time through our telescopes such as the JWST, and that time also dilates (the second gets shorter) going forward in time. The extent that time dilates looking backward in time and matter and space get relatively larger, according to the alternative ‘Hubble distance formula,’ is simply a function of the observed redshift.

According to these collective equations, for instance, at a redshift of ‘1’ an interval of time (the second) was twice as long and matter was twice the size 10.48 billion years ago. Looking forward in time the rate that time would pass would be twice as fast and matter half its present size for that same period of time looking forward into the future. Although this time and matter dilation may seem very small and impossible to detect except at cosmic scales, in fact it would have huge consequences for cosmology. For instance looking backward in time at a redshift of nine (z=9), galactic sizes on average would appear to have been 10 times bigger (their relative mass) and the rate of time would have been 10 times slower, as well as the redshift of galactic light would have been 10 times longer (z+1). As to being a theory of relativity, in their own timeframes all galaxies etc. would appear the same to a potential observer there, as they do to us in our local timeframe.

We believe from this perspective and related cosmology, all of the JWST observations and contradictions can be more easily explained and understood. Below are links to some of the well-known problems that can be explained-away by this cosmology and this new, simpler theory of relativity. We believe the word “simpler“can be better understood by readers that can understand the equations in the link above.

https://www.livescience.com/space/cosmology/james-webb-telescope-confirms-huge-crisis-in-our-understanding-of-cosmic-expansion

https://www.advancedsciencenews.com/a-big-ring-in-the-sky-challenges-modern-cosmology/

(as well as many other links that explain the problems with mainstream cosmology today)

OUR OTHER VERY IMPORTANT AND SUCCESSFUL PAST PAPERS:

Theory of Everything 14:

https://www.researchgate.net/publication/353700439_Theory_of_Everything_14

Grand Unified Theory:

https://www.researchgate.net/publication/355132702_A_Grand_Unified_Theory

Simple but Exact Calculations of Spiral Galaxy Rotations, explaining away dark matter: A generally unrecognized force of equal importance to gravity (explaining away dark matter and Modified Newtonian Gravity), with exact predictions and statistical justification.

https://www.researchgate.net/publication/337757736_Simple_but_exact_calculations_of_spiral_galaxy_rotations_without_dark_matter_or_modified_gravity

Standard and Alternative Cosmology: Cosmology that Contradicts the Big Bang

A co-authored book with many interesting insights and equations.

https://www.researchgate.net/publication/337591972_Standard_and_Alternative_Cosmology

CONTACT INFORMATION:

Attn. Forrest Noble USA at pantheory.org@gmail.com, cell phone numbers (562) 331-8334, (562) 414-8299, and home (562) 924-3313. Please leave a message if necessary and we will get back to you as soon as possible concerning your comments, questions, inquiries, corrections, etc. – with best regards Forrest Noble

MULTIMEDIA:

IMAGE link for media: https://www.Send2Press.com/300dpi/23-0720-s2p-pantheory-300dpi.jpg

Image Caption: The James Webb space telescope (JWST) can look farther into the most distant universe than any other visual telescope.

NEWS SOURCE: Pantheory Research Organization


This press release was issued on behalf of the news source (Pantheory Research Organization), who is solely responsible for its accuracy, by Send2Press Newswire. Image, if any, was provided by the news source and not this website or the wire service. Information is believed accurate, as provided by the news source, but is not guaranteed.

To view the original story, visit: https://www.send2press.com/wire/the-pantheory-research-organization-is-announcing-its-latest-scientific-research-and-related-scientific-journal-published-papers-and-related-information/

Copr. © 2025 Send2Press® Newswire, Calif., USA. -- REF: S2P STORY ID: S2P130422 NOREL-3B


Down Payment Resource Reports a New Record of 2,624 Homebuyer Assistance Programs Nationwide in Q3 2025

Even as affordability pressures persist, program growth is giving lenders new tools to qualify more buyers and help more households achieve homeownership

ATLANTA, Ga., Oct. 21, 2025 (SEND2PRESS NEWSWIRE) — Down Payment Resource (DPR), the housing industry authority on homebuyer assistance program data and solutions, today released its Q3 2025 Homeownership Program Index (HPI) report. The report identifies 70 new programs launched in Q3, bringing the total number of available programs nationwide to a record 2,624. Additionally, 20 new program providers were added to DPR’s database in Q3, bringing its provider total to 1,360.

Down Payment Resource Reports a New Record of 2,624 Homebuyer Assistance Programs Nationwide in Q3 2025
Image caption: Down Payment Resource Reports a New Record of 2,624 Homebuyer Assistance Programs Nationwide in Q3 2025.

Down payment assistance (DPA) can be used by lenders to lower a homebuyer’s loan-to-value (LTV) ratio by an average of 6%, helping them qualify more of their mortgage-ready buyers. In addition to down payments, many DPA programs can help with closing costs, prepaid expenses, buying down the mortgage interest rate and lessening mortgage insurance expenses. In some cases, buyers can combine multiple programs for even greater savings.

This assistance is vital as the median home price in the U.S. increased to $375,000 in Q3 2025, from $369,000 in Q2. Homebuyers finally got a break in Q3: mortgage rates eased, with the average 30-year fixed rate dipping from 6.75% in mid-July to 6.26% by mid-September.

“With home prices continuing to rise and mortgage rates still hovering near 6.5%, lenders know how challenging it can be to qualify today’s homebuyers. The good news is that there are now more tools than ever to help,” said Rob Chrane, founder and CEO of DPR. “In Q3 alone, 70 new homebuyer assistance programs were introduced. These resources — available in every U.S. county, with more than 2,000 counties offering 10 or more programs — are helping lenders reduce LTV ratios to qualify more mortgage-ready buyers and close more loans, even in a tight market.”

KEY Q3 2025 HPI REPORT FINDINGS:

An examination of the existing 2,624 homebuyer assistance programs on October 1, 2025, resulted in the following key findings:

  • 70 homebuyer assistance programs were added in Q3 2025, a 3% increase from Q2 2025. 996 programs (38%) are available to repeat buyers and 1,628 (62%) support first-time homebuyers. It’s also essential to note that military homebuyers can often qualify for first-time buyer programs, even if they have previously purchased a residence. 273 programs (10%) do not have income restrictions, increasing the number of buyers who might qualify for assistance. 32 programs support first-generation homebuyers, representing a 3% increase over the last quarter.
  • Of the total programs, 2,110 (80%) can be used to purchase new construction homes. These programs typically help cover a portion of the buyer’s down payment and/or closing costs, similar to assistance for resale properties.
  • The number of programs supporting manufactured housing grew 5%, from 1,006 in Q2 2025 to 1,052 in Q3 2025. Recent estimates suggest that manufactured homes remain significantly less expensive per square foot than site-built homes. According to the Manufactured Housing Institute, new manufactured homes average approximately $85 per square foot, compared to $164 per square foot for traditional site-built homes.
  • 909 programs support the purchase of multi-family housing, a 6% increase from the previous quarter. Of these, a growing number of programs support purchasing three-unit homes (606) and four-unit homes (578). Investing in multifamily properties can generate cash flow and offer buyers tax advantages.
  • The majority of programs, 1,464 (56%), are second-mortgage programs, up 1% from Q2. 272 (10%) are combined assistance programs, which typically blend a first mortgage (usually below market rate) and down payment assistance in the form of a second mortgage, a grant, or a combination of the two. 246 programs (9%) were first-mortgage programs.
  • 53% of DPAs (1,024 programs) offer partial or full forgiveness over time — a 3% increase from the previous quarter — provided the homeowner meets specific requirements, such as maintaining the property as their primary residence.
  • 1,023 programs (39%) were offered through municipalities or local program providers, a 1% increase over the previous quarter. 564 programs are sponsored by nonprofits, a 3% quarterly increase. State housing authorities (HFAs) accounted for 18% of programs (477), 3% higher than the previous quarter.
  • 203 programs offer special incentives based on the buyer’s occupation or other characteristics. Of these, 71 (35%) support educators — up 4% from the previous quarter — 52 (26%) assist Native American homebuyers, 50 (25%) serve protectors and police, 49 (24%) are available to military Veterans (up 9% from Q2), and 38 (19%) support active-duty military (also up 9% from Q2).
  • There are programs in all 50 states; 348 in California alone, followed by Florida (198) and Texas (126). 125 of the programs being tracked by DPR are considered “multi-state programs.”

A more detailed analysis of the Q3 2025 HPI findings, including infographics and examples of the programs described in this release, can be found on DPR’s website at: https://downpaymentresource.com/professional-resource/down-payment-assistance-hits-record-high-in-q3-2025-with-2624-programs-and-counting/

For a complete list of homebuyer assistance programs by state, visit: https://downpaymentresource.com/wp-content/uploads/2025/10/HPI-state-by-state-data.Q32025.pdf.

Members of the media are encouraged to contact DPR for data specific to their reporting needs.

METHODOLOGY:

Published quarterly, DPR’s HPI surveys the funding status, eligibility rules and benefits of U.S. homebuyer assistance programs administered by state and local housing finance agencies, municipalities, nonprofits and other housing organizations. DPR communicates with over 1,300 program providers throughout the year to track and update the country’s wide range of homeownership programs, including down payment and closing cost programs, Mortgage Credit Certificates (MCCs) and affordable first mortgages, in the DOWN PAYMENT RESOURCE® database.

About Down Payment Resource:

Down Payment Resource (DPR) is the housing industry authority on homebuyer assistance program data and solutions. With a database that tracks more than 2,600 programs and toolsets for mortgage lenders, multiple listing services (MLSs) and API users, DPR helps housing professionals connect homebuyers with the assistance they need. DPR frequently lends its expertise to nonprofits, housing finance agencies, policymakers, government-sponsored enterprises and trade organizations seeking to improve housing affordability. Its technology is used by seven of the top 25 mortgage lenders, the three largest real estate listing websites and 600,000 real estate agents. For more information, visit https://downpaymentresource.com/.

X: @DwnPmtResource #downpaymentassistance #affordabilitycrisis #housingaffordability #mortgage #housingequity #downpayment

NEWS SOURCE: Down Payment Resource


This press release was issued on behalf of the news source (Down Payment Resource), who is solely responsible for its accuracy, by Send2Press Newswire. Image, if any, was provided by the news source and not this website or the wire service. Information is believed accurate, as provided by the news source, but is not guaranteed.

To view the original story, visit: https://www.send2press.com/wire/down-payment-resource-reports-a-new-record-of-2624-homebuyer-assistance-programs-nationwide-in-q3-2025/

Copr. © 2025 Send2Press® Newswire, Calif., USA. -- REF: S2P STORY ID: S2P130344 NOREL-3B


LenderLogix Q3 2025 Homebuyer Intelligence Report Reveals Subtle Shifts in Pre-Approval Volume and Post-App Behavior

BUFFALO, N.Y., Oct. 16, 2025 (SEND2PRESS NEWSWIRE) — LenderLogix, a leading provider of mortgage point-of-sale and automation software for banks, credit unions, independent mortgage banks, and brokers, today announced the release of the Homebuyer Intelligence Report, a quarterly summary of insights into borrower behavior during the home-buying process based on data collected by the LenderLogix suite of tools. The latest report covers data collected during the pre-approval and borrower application process in the third quarter (Q3) of 2025.

Infographic: LenderLogix's Q3 2025 Homebuyer Intelligence Report.
Image caption: Infographic: LenderLogix’s Q3 2025 Homebuyer Intelligence Report.

Pre-Approvals

In Q3 2025, borrowers generated 8.61% fewer pre-approval letters through LenderLogix’s QuickQual pre-approval platform than in Q2 2025. The average number of pre-approved borrowers per loan officer decreased from 28.6 in Q2 2025 to 25.2 in Q3 2025.

The average loan amount on pre-approval letters declined from $367,305 in Q2 to $328,997 in Q3. Likewise, the average sale price fell sharply from $423,667 to $385,822. However, the average down payment percentage moved in the opposite direction, rising from 13.3% to 14.7% as borrowers brought more funds to the table.

Conventional loans remained the most popular loan type for pre-approved borrowers in Q3, decreasing marginally from 74.7% to 74.6% from the prior quarter. FHA pre-approvals increased marginally from 18.6% to 18.7%. VA decreased slightly from 4.5% to 4.2%, and USDA (1%) maintained its share from Q2 to Q3 2025.

“Despite a modest seasonal decline in pre-approval activity and loan amounts, borrowers are signaling seriousness through larger down payments and steady interest across loan types,” said LenderLogix Co-Founder and CEO Patrick O’Brien. “These trends point to a purchase market that is more price-conscious but still active.”

Borrower Conversion

Of the borrowers using QuickQual in Q3 2025, the average number of days between pre-approval and loan submission increased from 86.3 to 89.5 days in Q3.

From pre-approval to loan application, the conversion rate among borrowers held steady at 56% in Q3. Borrowers required an average of eight pre-approval letters before converting, maintaining the Q2 average into Q3. In total, new applications through the LiteSpeed point-of-sale (POS) platform increased 1.5% from Q2 2025 to Q3 2025.

“Borrower conversion remained steady this quarter, even though the timeline between pre-approval and loan submission lengthened,” said O’Brien. “This suggests that homebuyers are staying engaged despite navigating longer home search cycles.”

Post-Application Engagement

In Q3 2025, the number of documents uploaded through LiteSpeed grew 1.5% quarter-over-quarter. The number of newly created needs lists, including both online applications and those entered by loan officers, increased 1.6% in Q3.

Successful verification of income and employment (VOIE) through POS across all providers increased from 17.1% in Q2 to 17.8% in Q3. Verification of assets (VOA) decreased slightly from 33.7% to 31.2% over the same period.

“Post-application activity showed modest growth, and verification performance remains an area where lenders can continue to gain efficiency,” O’Brien added. “With meaningful differences in verification success rates between providers, the data underscores the importance of lender flexibility and smart vendor selection when optimizing workflow performance.”

Data from LenderLogix Homebuyer Intelligence Report is available to the industry free of charge. To learn more about LenderLogix, visit www.lenderlogix.com.

About LenderLogix:

LenderLogix leverages the four decades of firsthand mortgage origination and real estate experience of its executive team to design customized software to meet the needs of today’s mortgage lenders. The company’s suite of products addresses the speed at which today’s real estate market moves by delivering technology solutions that create agile and informed borrowers, build strong referral partners and ultimately save lenders time and money. For more information, visit https://www.lenderlogix.com/.

NEWS SOURCE: LenderLogix


This press release was issued on behalf of the news source (LenderLogix), who is solely responsible for its accuracy, by Send2Press Newswire. Image, if any, was provided by the news source and not this website or the wire service. Information is believed accurate, as provided by the news source, but is not guaranteed.

To view the original story, visit: https://www.send2press.com/wire/lenderlogix-q3-2025-homebuyer-intelligence-report-reveals-subtle-shifts-in-pre-approval-volume-and-post-app-behavior/

Copr. © 2025 Send2Press® Newswire, Calif., USA. -- REF: S2P STORY ID: S2P130206 NOREL-3B


Survey of World’s Archives Yields First Ever Master Directory, Boosting Access to History and Scientific Data

Newly launched Guide to Public Archives equips researchers to quickly locate rich data in national, regional, local and digital archives

LOS ANGELES, Calif., Oct. 16, 2025 (SEND2PRESS NEWSWIRE) — Newsjunkie, the journalism site known for “Who’s Behind the News” articles, announced today the release of Guide to Public Archives, the news industry’s first comprehensive directory of historical, cultural, and scientific archives maintained for public access. The Guide is designed to serve researchers seeking information from the astonishing array of curated collections across the globe, some dating as far back as the 13th century. Over 4,000 collections are represented across 800 repositories, with more set to be added to the database next year.

Newsjunkie - newsjunkie.net logo
Image caption: Newsjunkie.net logo.

The Guide to Public Archives provides essential thumbnail sketches about archives, libraries, and repositories worldwide, including descriptions of collections, contact information, and access requirements. By centralizing the information into one gateway service, Newsjunkie improves the discovery process, helping users find sources and services for their research.

“Professional archives preserve our collective history, and support ongoing scholarship within almost every field,” said Newsjunkie publisher Gordon Whiting. “Our guide makes the search for primary materials more fun, less tedious.”

The Guide includes archives spanning multiple disciplines and regions, from ancient census data to modern literature, photographs and recordings, to newspapers, government documents, scientific records, and specialized collections focused on particular historical periods, cultures, industries, or communities. Collections of the scale of Library of Congress and The Vatican are included, as well as numerous local and single-subject repositories.

Newsjunkie developed the Guide to Public Archives in response to growing interest from journalists who struggle to locate which archives out of thousands hold materials relevant to their assignments. The Guide streamlines the process and encourages broader engagement with facilities, artifacts and data that might not have been known to the user in the past. “We’re developing new filter tools to help navigate these spaces,” said Whiting. “The sheer number of collections and artifacts is a challenge to master, but very exciting.”

The Guide to Public Archives is available free of charge at https://Newsjunkie.net/archives/.

More information about the Guide and other resources for journalists and researchers may be found at https://newsjunkie.net/about.

About Newsjunkie:

Newsjunkie (Newsjunkie.net) is a Los Angeles-based, internationally-focused resource site for journalists, offering data and commentary on news organizations, media owners, journalism schools, and best practices in the worlds of editing, reporting, and publishing. More at https://newsjunkie.net/.

LOGO link for media: https://www.Send2Press.com/300dpi/25-1016-s2p-newsjunkie-300dpi.webp

NEWS SOURCE: Newsjunkie


This press release was issued on behalf of the news source (Newsjunkie), who is solely responsible for its accuracy, by Send2Press Newswire. Image, if any, was provided by the news source and not this website or the wire service. Information is believed accurate, as provided by the news source, but is not guaranteed.

To view the original story, visit: https://www.send2press.com/wire/survey-of-worlds-archives-yields-first-ever-master-directory-boosting-access-to-history-and-scientific-data/

Copr. © 2025 Send2Press® Newswire, Calif., USA. -- REF: S2P STORY ID: S2P130197 NOREL-3B


Optimal Blue report: Rate rally drives 28% surge in September lock volumes

Affordability gains fuel with biggest refi wave since early 2022, MSR values dip and securitization trends point to rising large-lender market share

PLANO, Texas, Oct. 14, 2025 (SEND2PRESS NEWSWIRE) — Optimal Blue today released its September 2025 Market Advantage mortgage data report, which showed a sharp increase in rate-lock activity as mortgage rates fell throughout the month to their lowest levels in nearly a year. Total lock volume rose 28% month over month (MoM), led by a surge in refinance lending as borrowers seized on the opportunity to lower monthly payments. Purchases also climbed 6% MoM, outperforming typical seasonal trends as improved affordability brought more buyers into the market.

Optimal Blue's September 2025 Market Advantage mortgage data report
Image caption: Image caption: Optimal Blue’s September 2025 Market Advantage mortgage data report.

“The rate rally that began in late summer accelerated in September, and borrowers reacted quickly,” said Mike Vough, head of corporate strategy at Optimal Blue. “Rate-and-term refinance locks jumped 153% month over month, lifting total refi share to 39% – the highest level we’ve seen in more than two years. That momentum also spilled into purchase lending as affordability improved, particularly for first-time homebuyers.”

The Optimal Blue Mortgage Market Indices (OBMMI) 30-year conforming fixed rate, the benchmark for CME Group’s Mortgage Rate futures, ended September at 6.32%, down 18 basis points (bps) from August. Jumbo rates dropped 11 bps to 6.47%, FHA fell 18 bps to 6.08% and VA declined 18 bps to 5.82%, reinforcing the broader affordability shift seen across loan types.

The report also highlighted notable movements in capital markets execution. Sales to the agency cash window and aggregators each fell 100 bps to 23% and 32% respectively, while agency mortgage-backed security (MBS) executions increased to 42% from 40%, reflecting stronger securitization activity among large lenders. The share of loans sold at the highest pricing tier climbed to 78%, up 300 bps, suggesting less focus on delivery profiles and fewer eligibility exceptions influenced pricing decisions.

“This combination of stronger pricing and greater securitization participation underscores lenders’ efforts to optimize execution as volume rebounds while maintaining profitability,” Vough said. “Even as MSR values edged down 6 bps in September, nearly eight in ten loans were sold at the highest pricing tier, showing how lenders are offsetting that compression through broader investor engagement.”

Key findings from the Market Advantage report, derived from direct-source mortgage lock and secondary market data, include:

Volume trends and market composition

  • Lock activity jumps: Total rate-lock volume increased 28% in September as falling rates reignited borrower demand.
  • Purchase volume rises: Purchase locks climbed 6% MoM and 9% year over year (YoY), outperforming typical late-season expectations.
  • Refinances dominate growth: Refi share expanded to 39% of all locks – the highest since early 2022 – driven by a 153% MoM increase in rate-and-term refinances and a 13% gain in cash-outs.
  • Refi pull-through improves: The pull-through rate for purchases climbed 58 bps to 83.6%. Refinance pull-through rose 82 bps to 60.2%.

Rates and pricing

  • Rates retreat across loan types: The OBMMI 30-year conforming fixed rate fell 18 bps to 6.32%. Jumbo rates dropped 11 bps to 6.47%, FHA loan rates fell 18 bps to 6.08% and VA loan rates declined 18 bps to 5.82%.
  • MSR valuations ease: Servicing values for conforming 30-year loans slipped 6 bps to 1.09% (a 4.36 multiple), mirroring rate declines and an average 30 bps drop in OBMMI levels across the month.
  • Lenders capture stronger execution: The share of loans sold at the highest pricing tier climbed to 78%, up 300 bps from August, signaling decreased focus on lender profile and eligibility and stronger focus on improved profitability.

Channel and execution

  • Securitization strengthens: Agency MBS executions increased to 42% from 40%, while deliveries to the agency cash window and aggregators fell 100 bps each to 23% and 32%, respectively.
  • Investor engagement steady: The average number of active investors held at 11, consistent with recent months as secondary market liquidity remained stable.

Product mix and borrower profiles

  • Conforming and VA gain share: Conforming and VA each picked up just over 1 percentage point of market share as borrowers in those segments moved quickly to refinance.
  • Credit profiles strengthen in refis: Average credit scores rose to 746 (up 9 points) for rate-and-term refinances and to 701 (up 7 points) for cash-outs as higher-credit borrowers responded first to lower rates.
  • DTI trends lower: Debt-to-income ratios declined for both conforming and FHA production and were down across all products YoY, signaling improving affordability.
  • FTHB participation increases: First-time homebuyer share rose in both FHA and VA production – up 1 bp each – while conforming was unchanged.
  • Loan amounts edge higher: The average loan amount was $403,746, up from $386,387 in August and $382,476 in July. September averages ranged from $605,542 in metro New York to $305,829 in Indianapolis. Average LTVs ranged from 73.57 in New York to 82.22 in Indianapolis.

To view the full September 2025 Market Advantage report, subscribe for free: https://engage.optimalblue.com/market-advantage. Subscribers receive a report PDF each month with the latest data. Members of the press are eligible for special, advance access each month and should contact Olivia DeLancey to be added to the media list.

This month’s Market Advantage podcast features Andria Lightfoot, vice president of client success at FirstClose. Access the podcast: https://market-advantage.captivate.fm/episode/episode-13.

About the Market Advantage Report

Optimal Blue issues the Market Advantage mortgage report each month to provide transparency and insight into U.S. mortgage trends and drivers of lending profitability. Data is sourced from the Optimal Blue PPE, which is used to price and lock more than one-third of all mortgages nationwide, and Optimal Blue’s hedging and loan trading system, which supports approximately 40% of loans hedged and sold into the secondary market. As the leader in mortgage capital markets technology, Optimal Blue has a direct view of both origination and secondary market activity and the interconnectedness of the two. Unlike self-reported survey data, Optimal Blue’s direct-source data accurately reflect the in-process loans in lenders’ pipelines and secondary market executions. Visit Optimal Blue’s website to subscribe to receive the free report each month.

Nothing herein shall be construed as, nor is Optimal Blue providing, any legal, trading, hedging, or financial advice.

About Optimal Blue

Optimal Blue powers profitability across the mortgage capital markets ecosystem. As the industry’s only end-to-end capital markets platform, our technology, data and integrations bridge the primary and secondary markets to help lenders of all sizes maximize performance – from pricing transparency and accuracy to margin protection and every step in between. Backed by over 20 years of proven expertise, our modern, cloud-native technology delivers the real-time automation, actionable data and seamless connectivity lenders need to navigate market volatility and scale for growth. To learn more about how Optimal Blue delivers measurable ROI, visit OptimalBlue.com.

MUILTIMEDIA:

Image link for media: https://www.Send2Press.com/300dpi/25-1014-s2p-optbluesep25-300dpi.webp

Image caption: Optimal Blue’s September 2025 Market Advantage mortgage data report.

NEWS SOURCE: Optimal Blue


This press release was issued on behalf of the news source (Optimal Blue), who is solely responsible for its accuracy, by Send2Press Newswire. Image, if any, was provided by the news source and not this website or the wire service. Information is believed accurate, as provided by the news source, but is not guaranteed.

To view the original story, visit: https://www.send2press.com/wire/optimal-blue-report-rate-rally-drives-28-surge-in-september-lock-volumes/

Copr. © 2025 Send2Press® Newswire, Calif., USA. -- REF: S2P STORY ID: S2P130114 NOREL-3B


U.S. mortgage loan originations to climb nearly 10% in 2026, iEmergent forecasts

New three-year outlook also sees dollar originations growing 13% to reach $2.27 trillion next year

DES MOINES, Iowa, Oct. 8, 2025 (SEND2PRESS NEWSWIRE) — iEmergent, a forecasting and advisory services firm for the financial services, mortgage and real estate industries, today announced the availability of its 2025–2027 U.S. Mortgage Origination Forecast. The firm projects total originations will climb to $2.27 trillion in 2026, a 13% increase over 2025, as slowing economic growth and easing interest rates fuel a rebound in refinance activity alongside modest purchase gains.

Bar graph showing iEmergent's 3-year U.S. Mortgage Origination Forecast for 2025-2027 by loan count/units.
Image caption: Bar graph showing iEmergent’s 3-year U.S. Mortgage Origination Forecast for 2025-2027 by loan count/units.

According to iEmergent Chief of Forecasting Mark Watson, the 2026 outlook reflects a shifting economic landscape. As tariff impacts spread, consumer confidence wanes and the labor market cools, GDP growth is expected to slow further, setting the stage for lower interest rates and a modest housing recovery. Long-term interest rates are expected to rise slightly by the end of 2025 but fall again in 2026 as growth weakens. That drop should spur a rebound in refinances and lift overall mortgage originations.

  • 2025: Total mortgage origination volume is forecast to surpass $2 trillion for the first time since 2022, driven by a 48% jump in refinance dollars and 12% in purchase dollar gains, an overall 20% increase from 2024.
  • 2026: Total mortgage origination volume is projected to reach $2.27 trillion, a 13% increase from 2025. Refinance units are expected to grow 24% as lower rates boost activity, and a 2.3% increase in purchase units will help push total loan count up nearly 10% year-over-year.
  • 2027: Purchase activity is projected at 4.09 million loans totaling $1.56 trillion, while refinance units are expected to hold steady at 2.37 million, with dollars dipping slightly at $754 billion.

“Crossing back above $2 trillion in 2025 signals renewed strength in the mortgage market,” Watson said. “By 2026, lower rates and moderating home prices should support activity, though affordability challenges will persist—especially for first-time buyers.”

Bar graph showing iEmergent's 3-year U.S. Mortgage Origination Forecast for 2025-2027 by dollar volume.
Image caption: Bar graph showing iEmergent’s 3-year U.S. Mortgage Origination Forecast for 2025-2027 by dollar volume.

“These national trends tell an important story, but they don’t tell the whole story,” said Laird Nossuli, CEO of iEmergent. “Every market will experience the next wave of recovery differently. iEmergent’s data gives lenders visibility into those differences, so they can see how mortgage activity is expected to shift in specific markets, even down to the census-tract level.”

Read Mark Watson’s latest blog for more detailed analysis and commentary on the forecast.

Methodology

For more than two decades, iEmergent has been predicting mortgage market trends with a level of precision that surpasses even the industry’s most trusted forecasts from the Mortgage Bankers Association, Freddie Mac and Fannie Mae. In fact, in almost 70% of the nation’s 84,414 census tracts, iEmergent’s U.S. Mortgage Origination Forecast has proven accurate to within 10 loans.

iEmergent’s proprietary forecasting method is a hybrid of several traditional demand forecast models. Many variables go into these forecasts, but there are two fundamental elements: first, the Purchase Mortgage Generation Rate (PMGR), which is the rate at which an individual market produces purchase mortgages. Second, the homebuyer pool: the number of households that are ready, willing and able to buy a home. By evaluating the relationship between each census tract’s homebuyer pool and PMGR, probability theory can be applied to estimate the number of purchase mortgage loans and dollars that will be originated in that market.

Read more about iEmergent’s approach to forecasting here: https://www.iemergent.com/insights/mortgage-opportunity-forecasting

About iEmergent

Founded in 2000, iEmergent provides mortgage lending forecasts and analytics to the lending, housing and real estate industries. The company offers an extensive variety of forecast and market intelligence products, including Mortgage MarketSmart, a visualization tool that helps lenders quantify how mortgage markets will change. For more information, visit https://www.iemergent.com/.

Tags: @iEmergent

Media Kit:
https://www.iemergent.com/docs/default-source/default-document-library/presskit_digitallinked.pdf

NEWS SOURCE: iEmergent


This press release was issued on behalf of the news source (iEmergent), who is solely responsible for its accuracy, by Send2Press Newswire. Image, if any, was provided by the news source and not this website or the wire service. Information is believed accurate, as provided by the news source, but is not guaranteed.

To view the original story, visit: https://www.send2press.com/wire/u-s-mortgage-loan-originations-to-climb-nearly-10-in-2026-iemergent-forecasts/

Copr. © 2025 Send2Press® Newswire, Calif., USA. -- REF: S2P STORY ID: S2P129999 NOREL-3B
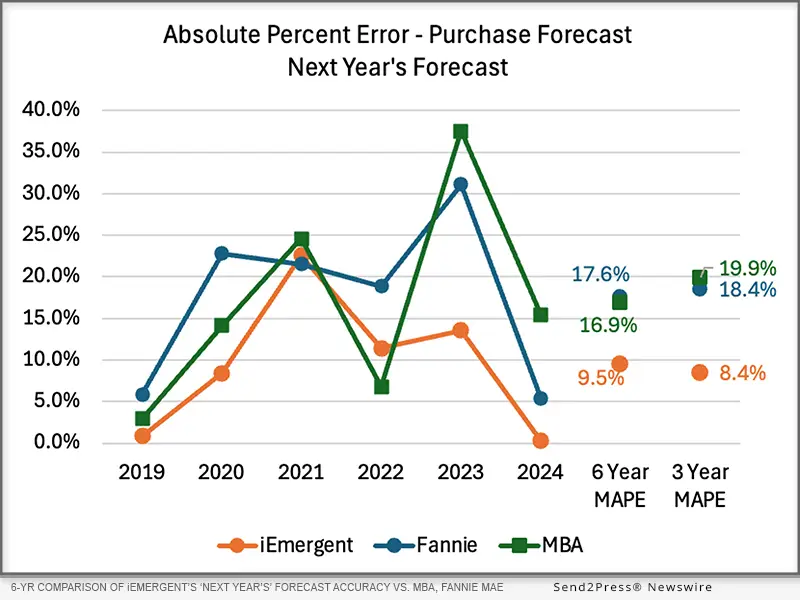
 

Investment Up Food & Beverage Greenlights 20 New Construction Projects, Up 17.65% for September 2025

JACKSONVILLE BEACH, Fla., Oct. 7, 2025 (SEND2PRESS NEWSWIRE) — Industrial SalesLeads today released the results of its September 2025 new planned capital project spending report for the Food and Beverage industry, which tracks North American planned industrial capital project activity, including facility expansions, new plant construction, and significant equipment modernization. Research confirmed 53 new projects within the Food and Beverage sector. New construction activity increased sharply. This jump represents a substantial 17.65% increase in new construction for the Food and Beverage industry month-over-month.

Investment Up Food and Beverage Greenlights 20 New Construction Projects, Up 17.65% for September 2025
Image caption: Investment Up Food and Beverage Greenlights 20 New Construction Projects, Up 17.65% for September 2025.

The following are selected highlights on new Food and Beverage industry construction news.

Food and Beverage Project Type

Processing Facilities – 33 New Projects

Distribution and Industrial Warehouse – 24 New Projects

Food and Beverage Project Scope/Activity

New Construction – 20 New Projects

Expansion – 11 New Projects

Renovations/Equipment Upgrades – 21 New Projects

Plant Closing – 7 New Projects

Food and Beverage Project Location (Top 10 States)

Florida – 5

Wisconsin – 5

Indiana – 4

Ohio – 4

Washington – 4

California – 3

Kansas – 3

Colorado – 2

Illinois – 2

Michigan – 2

Largest Planned Project

During the month of September, our research team identified 2 new Food and Beverage facility construction projects with an estimated value of $100 million or more.

The largest project is owned by Atlantic Sapphire, who is investing $350 million for the expansion of their processing facility in MIAMI, FL. Construction is occurring in multiple phases.

Top 10 Tracked Food and Beverage Projects

CONNECTICUT:

Global retail chain is planning for the construction of a 1 million sf distribution and office facility in WINDHAM COUNTY, CT. They are currently seeking approval for the project.

NEW YORK:

Beverage company is planning to invest $48 million for the construction of a 126,000 sf distribution center at 15 Liebich Ln. in HALFMOON, NY. They are currently seeking approval for the project. They will relocate their ALBANY, NY operations upon completion.

KANSAS:

Food products mfr. is planning to invest $34 million for the expansion and equipment upgrades on their processing facility in TOPEKA, KS. They are currently seeking approval for the project.

FLORIDA:

Meat processing company is planning to invest $28 million for the renovation and equipment upgrades on a recently acquired 50,000 sf processing facility at 5441 W. Fifth St. in JACKSONVILLE, FL. They are currently seeking approval for the project.

FLORIDA:

Beverage company is planning for the renovation and equipment upgrades on a 750,000 sf distribution center at 21451 N.W. 47th Ave. in MIAMI GARDENS, FL. They are currently seeking approval for the project.

OHIO:

Specialty food processing company is planning for the construction of a 328,000 sf distribution and office facility on Rome Rd. in COLUMBUS, OH. They are currently seeking approval for the project.

ILLINOIS:

Meat product mfr. is planning to invest $22 million for the expansion of their processing facility in GALESBURG, IL. They are currently seeking approval for the project.

PENNSYLVANIA:

Food products wholesaler is planning for the construction of a 200,000 sf warehouse facility in EAST COCALICO TWP., PA. They are currently seeking approval for the project.

WISCONSIN:

Brewery is planning to invest $16 million for the construction of a 33,000 sf production facility in HUDSON, WI. They are currently seeking approval for the project.

OHIO:

Food products mfr. is planning for the expansion of their processing and warehouse facility in DELPHOS, OH by 130,000 sf. They are currently seeking approval for the project. Construction is expected to start in late Fall 2025.

About Industrial SalesLeads, Inc.

Since 1959, Industrial SalesLeads, based in Jacksonville, FL is a leader in delivering industrial capital project intelligence and prospecting services for sales and marketing teams to ensure a predictable and scalable pipeline. Our Industrial Market Intelligence, IMI identifies timely insights on companies planning significant capital investments such as new construction, expansion, relocation, equipment modernization and plant closings in industrial facilities. The Outsourced Prospecting Services, an extension to your sales team, is designed to drive growth with qualified meetings and appointments for your internal sales team. Visit us at https://salesleadsinc.com/.

Each month, our team provides hundreds of industrial reports within a variety of industries, including:

https://www.salesleadsinc.com/industry/food-and-beverage/

https://www.salesleadsinc.com/blog/

NEWS SOURCE: Industrial SalesLeads Inc


This press release was issued on behalf of the news source (Industrial SalesLeads Inc), who is solely responsible for its accuracy, by Send2Press Newswire. Image, if any, was provided by the news source and not this website or the wire service. Information is believed accurate, as provided by the news source, but is not guaranteed.

To view the original story, visit: https://www.send2press.com/wire/investment-up-food-beverage-greenlights-20-new-construction-projects-up-17-65-for-september-2025/

Copr. © 2025 Send2Press® Newswire, Calif., USA. -- REF: S2P STORY ID: S2P129926 NOREL-3B
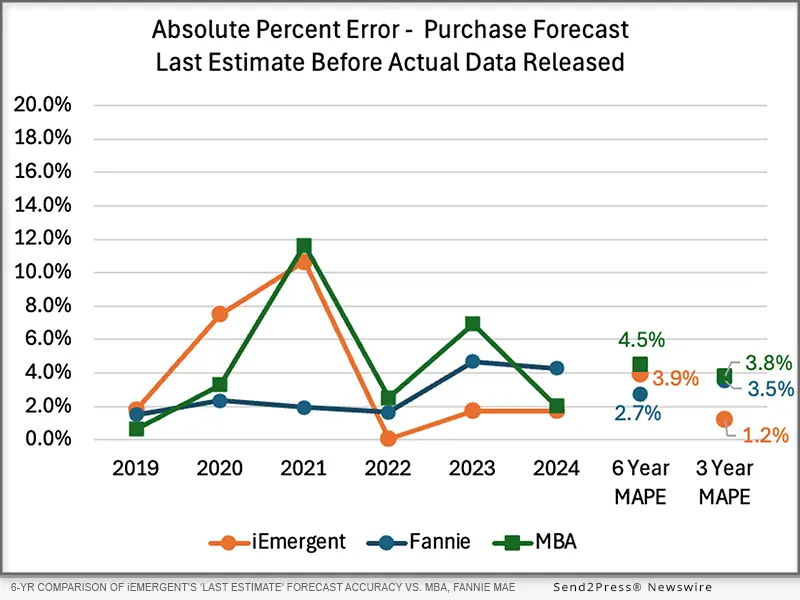
 

Industrial Manufacturing Sees 27.8% Jump in Renovation Projects, Proving Strong Investment Momentum into Fall 2025

Renovation activity showed notable growth, rising 27.8% from June to September 2025

JACKSONVILLE BEACH, Fla., Oct. 2, 2025 (SEND2PRESS NEWSWIRE) — Industrial SalesLeads announced today the September 2025 results for the new Planned Capital Project Spending Report for the Industrial Manufacturing industry. The firm, which tracks North American planned industrial capital project activity including facility expansions, new plant construction, and major equipment modernization confirmed 146 new projects in the industrial sector a 3.55% increase in planned capital investments since June. Renovation activity showed notable growth, rising 27.8% from June to September 2025.

Industrial Manufacturing Sees 27.8% Jump in Renovation Projects, Proving Strong Investment Momentum into Fall 2025
Image caption: Industrial Manufacturing Sees 27.8% Jump in Renovation Projects, Proving Strong Investment Momentum into Fall 2025.

The following are selected highlights on new Industrial Manufacturing industry construction news.

INDUSTRIAL MANUFACTURING – BY PROJECT TYPE

Manufacturing/Production Facilities – 123 New Projects

Distribution and Industrial Warehouse – 70 New Projects

INDUSTRIAL MANUFACTURING – BY PROJECT SCOPE/ACTIVITY

New Construction – 51 New Projects

Expansion – 35 New Projects

Renovations/Equipment Upgrades – 73 New Projects

Plant Closings – 10 New Projects

INDUSTRIAL MANUFACTURING – BY PROJECT LOCATION (TOP 10 STATES)

Texas – 15

California – 10

Indiana – 10

Pennsylvania – 9

New York – 8

Michigan – 7

Ohio – 7

South Carolina – 7

Georgia – 6

Virginia – 6

Florida – 5

LARGEST PLANNED PROJECT

During the month of September, our research team identified 23 new Industrial Manufacturing facility construction projects with an estimated value of $100 million or more.

The largest project is owned by GlaxoSmithKline, who is planning to invest $1.2 billion for the construction of a processing facility in UPPER MERION, PA. They are currently seeking approval for the project.

TOP 10 TRACKED INDUSTRIAL MANUFACTURING PROJECTS

TEXAS:

Shipbuilder is planning to invest $1 billion for the construction of a manufacturing and warehouse complex in GALVESTON, TX. They are currently seeking approval for the project.

ALABAMA:

Paper product mfr. is planning to invest $800 million for the expansion and equipment upgrades on their manufacturing facility in PERDUE HILL, AL. They are currently seeking approval for the project. Construction is expected to start in late 2025, with completion slated for 2027.

CALIFORNIA:

Biotechnology company is planning to invest $600 million for the construction of a laboratory, processing, and office facility on their campus in THOUSAND OAKS, CA. They have recently received approval for the project.

VIRGINIA:

Electrical equipment mfr. is planning to invest $457 million for the expansion of their manufacturing facility in SOUTH BOSTON, VA. They are currently seeking approval for the project. Construction is expected to start in late 2025, with completion slated for 2028.

TEXAS:

Cable mfr. is planning to invest $380 million for the construction of a manufacturing and warehouse facility at 19702 Kickapoo Rd. in WALLER, TX. They are currently seeking approval for the project. Construction is expected to start in 2026, with completion slated for late 2029.

LOUISIANA:

Microchip mfr. is planning to invest $370 million for the construction of a 40,000 sf manufacturing facility in RUSTON, LA. They are currently seeking approval for the project. Construction is expected to start in Spring 2026, with completion slated for Summer 2027.

SOUTH CAROLINA:

Automotive mfr. is planning to invest $300 million for the construction of a 2.3 million sf manufacturing, assembly, and warehouse campus in BLYTHEWOOD, SC. They are currently seeking approval for the project.

GEORGIA:

Solar panel mfr. is planning to invest $275 million for the construction of a manufacturing facility in MOULTRIE, GA. They are currently seeking approval for the project. Construction is expected to start in late 2025.

ARIZONA:

Semiconductor equipment mfr. is planning to invest $200 million for the renovation and equipment upgrades on a 182,000 sf manufacturing facility at 2377 S Arizona Ave. in CHANDLER, AZ. They are currently seeking approval for the project.

SOUTH CAROLINA:

Aerospace component mfr. is planning to invest $200 million for the construction of a 300,000 sf manufacturing facility in GREER, SC. They are currently seeking approval for the project. Completion is slated for 2027.

ABOUT INDUSTRIAL SALESLEADS, INC.

Since 1959, Industrial SalesLeads, based in Jacksonville, FL is a leader in delivering industrial capital project intelligence and prospecting services for sales and marketing teams to ensure a predictable and scalable pipeline. Our Industrial Market Intelligence, IMI identifies timely insights on companies planning significant capital investments such as new construction, expansion, relocation, equipment modernization and plant closings in industrial facilities. The Outsourced Prospecting Services, an extension to your sales team, is designed to drive growth with qualified meetings and appointments for your internal sales team. Visit us at salesleadsinc.com.

Each month, our team provides hundreds of industrial reports within a variety of industries, including:

Learn more: https://www.salesleadsinc.com/blog/

NEWS SOURCE: Industrial SalesLeads Inc


This press release was issued on behalf of the news source (Industrial SalesLeads Inc), who is solely responsible for its accuracy, by Send2Press Newswire. Image, if any, was provided by the news source and not this website or the wire service. Information is believed accurate, as provided by the news source, but is not guaranteed.

To view the original story, visit: https://www.send2press.com/wire/industrial-manufacturing-sees-27-8-jump-in-renovation-projects-proving-strong-investment-momentum-into-fall-2025/

Copr. © 2025 Send2Press® Newswire, Calif., USA. -- REF: S2P STORY ID: S2P129797 NOREL-3B

 

New Study Reveals Published Authors Command 2x Higher Rates and 86% Hiring Preference in Professional Services

LOS ANGELES, Calif., Sept. 29, 2025 (SEND2PRESS NEWSWIRE) — A groundbreaking new study from The Evolution of Publishing Institute reveals that published authorship creates a dramatic “Author Authority Premium” in professional services, with published authors commanding overwhelmingly higher preference rates, premium fees, and enhanced credibility compared to non-author counterparts with identical qualifications.

The Evolution of Publishing Institute
Image caption: The Evolution of Publishing Institute.

The comprehensive survey of 100 Los Angeles residents examined hiring preferences across three key professional service categories, uncovering striking advantages for professionals who have written books.

KEY FINDINGS:

Hiring Preferences Heavily Favor Authors:

  • 86% prefer hiring marketing consultants who are published authors (vs. 14% for non-authors)
  • 82% prefer business consultants with published books
  • 69% prefer financial advisors who have authored books

Significant Pricing Power:

  • Published authors can potentially command 2x higher consultation rates on average
  • Fee premiums range from 40-65% across professional service categories

Trust and Credibility Multiplier:

  • 86% trust content more when created by book authors vs. 14% for industry experts without books
  • Content trust multiplier of 6.1x higher preference for author-created materials

Professional Branding Impact:

  • LinkedIn headlines mentioning authorship see 44 percentage point boost in effectiveness
  • 72% find professional branding more compelling when authorship is highlighted

SPEAKING AND THOUGHT LEADERSHIP ADVANTAGES

The study also revealed substantial benefits for conference speaking and thought leadership positioning:

  • 83% prefer CEOs who authored business books as conference speakers vs. 17% for non-author CEOs
  • 68% view executives with published books as better qualified for thought leadership roles
  • Authority boost of +66 percentage points for published authors in speaking contexts

INDUSTRY IMPLICATIONS

“This data suggests that writing a book could be one of the best investments you can make in your career,” says Sara O’Neil, a board member at the Evolution of Publishing Institute. “It boosts your credibility and gives you a true edge over the competition.”

The findings indicate that books serve as powerful third-party validation of expertise, with published works creating what researchers term “credibility economics” in professional services.

STUDY METHODOLOGY AND LIMITATIONS

The survey was conducted among 100 Los Angeles residents using hypothetical scenarios comparing professionals with identical qualifications except for published authorship status. Researchers note that results are based on stated preferences rather than actual hiring decisions, and the study assumes generic “published author” status without considering book quality, publisher, or sales success.

Results may vary by specific professional service niches, and the sample was limited to Los Angeles residents.

ABOUT THE EVOLUTION OF PUBLISHING INSTITUTE

The Evolution of Publishing Institute conducts research on the intersection of publishing and professional development. More information is available at: https://publishingevolution.org/.

NEWS SOURCE: The Evolution of Publishing Institute


This press release was issued on behalf of the news source (The Evolution of Publishing Institute), who is solely responsible for its accuracy, by Send2Press Newswire. Image, if any, was provided by the news source and not this website or the wire service. Information is believed accurate, as provided by the news source, but is not guaranteed.

To view the original story, visit: https://www.send2press.com/wire/new-study-reveals-published-authors-command-2x-higher-rates-and-86-hiring-preference-in-professional-services/

Copr. © 2025 Send2Press® Newswire, Calif., USA. -- REF: S2P STORY ID: S2P129630 NOREL-3B

 

56 New Food and Beverage Capital Projects Highlighted with a Rise in Processing Facilities

This number is the same as the 56 new projects recorded in June, with a slight increase from the 55 projects in July

JACKSONVILLE BEACH, Fla., Sept. 11, 2025 (SEND2PRESS NEWSWIRE) — Industrial SalesLeads has released its August 2025 MiR report on new planned capital project spending for the Food and Beverage industry. The Firm, which tracks North American industrial capital project activity, including facility expansions, new plant construction, and significant equipment modernization projects, confirmed 56 new projects in the Food and Beverage sector for August. This number is the same as the 56 new projects recorded in June, with a slight increase from the 55 projects in July.

Industrial SalesLeads has released its August 2025 MiR report on new planned capital project spending for the Food and Beverage industry
Image caption: Industrial SalesLeads has released its August 2025 MiR report on new planned capital project spending for the Food and Beverage industry.

The report also highlights that there were 38 new projects for processing facilities in August, compared to 35 in July.

The following are selected highlights on new Food and Beverage industry construction news.

Food and Beverage Project Type

  • Processing Facilities – 38 New Projects
  • Distribution and Industrial Warehouse – 23 New Projects

Food and Beverage Project Scope/Activity

  • New Construction – 17 New Projects
  • Expansion – 15 New Projects
  • Renovations/Equipment Upgrades – 25 New Projects
  • Plant Closing – 3 New Projects

Food and Beverage Project Location (Top 10 States)

New York – 8

California – 5

Ohio – 5

Michigan – 4

Illinois – 3

Indiana – 3

Texas – 3

Georgia – 2

Maine – 2

North Carolina – 2

LARGEST PLANNED PROJECT

During the month of August, our research team identified 2 new Food and Beverage facility construction projects with an estimated value of $100 million or more.

The largest project is owned by Red Bull North America, who is planning to invest $740 million for the construction of a 2 million sf processing, distribution, and office facility at 2321 Concord Pkwy S in CONCORD, NC. They are currently seeking approval for the project.

TOP 10 TRACKED FOOD AND BEVERAGE PROJECTS

MINNESOTA:

Food product mfr. is planning to invest $54 million for a 35,000 sf expansion of their processing and research facility at 9000 Plymouth Ave N in GOLDEN VALLEY, MN. They have recently received approval for the project. Completion is slated for Fall 2027.

NEW YORK:

Brewery is planning to invest $50 million for the renovation and equipment upgrades on their production facility in ROCHESTER, NY. They are currently seeking approval for the project.

NEW YORK:

Specialty food processing facility is planning to invest $50 million for the construction of a 104,000 sf processing facility at 3320 S. Richey St. in WATERTOWN, NY. They are currently seeking approval for the project. Construction is expected to start in late 2025, with completion slated for Summer 2027.

TENNESSEE:

Specialty bakery product mfr. is planning to invest $49 million for the renovation and equipment upgrades on a processing facility in ROSSVILLE, TN. They have recently received approval for the project.

MICHIGAN:

Ice cream mfr. is planning to invest $40 million for the expansion, renovation, and equipment upgrades on their processing facility in HOLLAND, MI. They are currently seeking approval for the project.

CALIFORNIA:

Vegetable plant supplier is planning for a 1.6 million sf expansion of their growing, processing, and warehouse facilities in SANTA MARIA, CA. They are currently seeking approval for the project.

PENNSYLVANIA:

Specialty food product mfr. is planning for the renovation and equipment upgrades on a 450,000 sf distribution center on S. Eagle Valley Rd. in SNYDER TOWNSHIP, PA. They have recently received approval for the project. They will consolidate their operations upon completion.

OHIO:

Breakfast product mfr. is expanding and planning for the renovation and equipment upgrades on an additional 244,000 sf of processing space at 7757 Union Centre Blvd. in WEST CHESTER, OH. They are currently seeking approval for the project.

WISCONSIN:

Dairy products mfr. is planning to invest $14 million for the expansion, renovation, and equipment upgrades on their processing facility in WESTBY, WI. They are currently seeking approval for the project.

FLORIDA:

Food products distributor is planning for the renovation and equipment upgrades on a recently acquired 171,000 sf warehouse facility at 16300 N.W. 97th Ave. in HIALEAH, FL. They are currently seeking approval for the project.

About Industrial SalesLeads, Inc.

Since 1959, Industrial SalesLeads, based in Jacksonville, FL is a leader in delivering industrial capital project intelligence and prospecting services for sales and marketing teams to ensure a predictable and scalable pipeline. Our Industrial Market Intelligence, IMI identifies timely insights on companies planning significant capital investments such as new construction, expansion, relocation, equipment modernization and plant closings in industrial facilities. The Outsourced Prospecting Services, an extension to your sales team, is designed to drive growth with qualified meetings and appointments for your internal sales team. Visit us at https://salesleadsinc.com/.

Each month, our team provides hundreds of industrial reports within a variety of industries, including:

LEARN MORE: https://www.salesleadsinc.com/industry/industrial-manufacturing/

NEWS SOURCE: Industrial SalesLeads Inc


This press release was issued on behalf of the news source (Industrial SalesLeads Inc), who is solely responsible for its accuracy, by Send2Press Newswire. Image, if any, was provided by the news source and not this website or the wire service. Information is believed accurate, as provided by the news source, but is not guaranteed.

To view the original story, visit: https://www.send2press.com/wire/56-new-food-and-beverage-capital-projects-highlighted-with-a-rise-in-processing-facilities/

Copr. © 2025 Send2Press® Newswire, Calif., USA. -- REF: S2P STORY ID: S2P129276 NOREL-3B
 

Refinances surge nearly 70% as purchase activity falls 10% in August

Seasonal slowdown weighs on purchases; lenders lean on securitization and non-QM to drive performance

PLANO, Texas, Sept. 10, 2025 (SEND2PRESS NEWSWIRE) — Optimal Blue today released its August 2025 Market Advantage mortgage data report, which found a sharp split between purchase and refinance trends as seasonal factors and falling rates reshaped origination activity. Total lock volume dipped about 2% month over month (MoM) as a roughly 10% drop in purchase locks outweighed the strongest month for rate-and-term refinances this year, which surged nearly 70%. Non-QM lending also reached a new milestone in August, climbing to a record 8.3% of originations – up from 5.6% a year earlier and just 1.4% in August 2020 – extending the steady growth trend first highlighted in last month’s report.

Optimal Blue's August 2025 Market Advantage mortgage data report
Image caption: Optimal Blue’s August 2025 Market Advantage mortgage data report.

“Borrowers are responding quickly to rate improvements, driving the strongest month for rate-and-term refinances we’ve seen this year,” said Mike Vough, head of corporate strategy at Optimal Blue. “At the same time, purchase activity is beginning its typical seasonal decline, while product mix is shifting with non-QM lending at record levels.”

The OBMMI 30-year conforming fixed rate, the benchmark for CME Group’s Mortgage Rate futures, ended August at 6.49%, down nearly a quarter point from July. Jumbo, FHA and VA rates also declined, falling 32, 24 and 33 basis points (bps), respectively.

The report also pointed to significant changes in capital markets execution, with securitization playing a larger role in loan sales. Agency cash window deliveries fell to 24% while agency MBS executions climbed to 40%, highlighting stronger securitization activity among larger lenders.

“This trend underscores how lenders are strategically adapting to optimize execution in order to gain market share,” Vough said. “We’re seeing deeper engagement in securitization alongside more loans sold to the highest price during loan sales, signaling that capital markets strategies are adjusting to increase profitability.”

Key findings from the Market Advantage report, derived from direct-source mortgage lock and secondary market data, include:

Volume trends and market composition

  • Lock volumes dip: Overall activity slowed 1.8% in August as the seasonal decline in purchase demand outpaced gains in refinance activity.
  • Purchase volumes slip: Purchase volume fell 9.8% MoM but remained flat year over year (YoY), ushering in the typical post–peak season slowdown.
  • Refis surge: Refinances rose to 26% of originations, up sharply MoM and YoY, as rate-and-term refinances surged 69.8% while cash-outs gained 2.2%.

Rates and pricing

  • Benchmark rates drop: The OBMMI ended August at 6.49%, down nearly a quarter point from July. Jumbo rates fell 32 bps to 6.57%, FHA decreased 24 bps to 6.26% and VA declined 33 bps to 6.00%, creating opportunities across loan types.
  • Pricing strength improves: Loans sold at the highest pricing tier rose to 75%, a 5-point increase, suggesting lenders delivered cleaner loan profiles and captured stronger pricing.
  • MSR valuations soften: MSR values dipped to 1.15% for conforming 30-year loans, down 4 bps, in line with lower rates that compressed servicing valuations.

Channel and execution

  • Cash share declines: Agency cash window sales fell 200 bps to 24% as lenders leaned less on cash executions in favor of strategic delivery methods.
  • MBS executions rise: Agency MBS executions climbed to 40%, reflecting increased securitization by larger lenders optimizing capital markets execution and market share.
  • Pull-through rates mixed: Purchase pull-through rose 22 bps to 84.2%, while refinance pull-through slipped 15 bps to 61%, indicating some softening in refi pipeline performance.

Product mix and borrower profiles

  • Non-QM hits record: Non-QM share rose to 8.34% of all originations in August, up from 8.03% in July and setting a new record high.
  • Conforming declines: Conforming share fell 123 bps to 51%. VA loans gained 78 bps to 12.1%, non-conforming increased 48 bps to 17.3%, FHA edged up 1 bp to 19% and USDA dipped 5 bps to 0.7%.
  • New build activity softens: Planned unit development (PUD) lending fell below 28% of production, down more than 4.5% YoY as new construction market share continued to contract.
  • FTHB activity steady: First-time homebuyer share held flat for conforming and FHA loans and dipped slightly for VA.
  • Borrower profiles remain strong: The average conforming FICO Score was 756, unchanged MoM. Average loan amounts rose to $386,387 from $382,476 in July, ranging from $600,110 in metro New York to $304,511 in Indianapolis. Average LTVs ranged from 73.56 in New York to 81.61 in Indianapolis.
  • ARMs hold: Adjustable-rate mortgages accounted for 10.25% of overall lock activity.

To view the full August 2025 Market Advantage report, complete the free subscription form: https://engage.optimalblue.com/market-advantage. Subscribers receive a report PDF each month with the latest data. Members of the press are eligible for special, advance access each month and should contact Olivia DeLancey to be added to the media list.

This month’s Market Advantage podcast features Optimal Blue Chief Technology Officer Seever Sulaiman. Access the podcast: https://market-advantage.captivate.fm/episode/episode-12 .

About the Market Advantage Report

Optimal Blue issues the Market Advantage mortgage report each month to provide insight into U.S. mortgage trends and drivers of lending profitability. Data is sourced from the Optimal Blue PPE, which is used to price and lock more than one-third of all mortgages nationwide, and Optimal Blue’s hedging and loan trading system, which supports approximately 40% of loans hedged and sold into the secondary market. As the leader in mortgage capital markets technology, Optimal Blue has a direct view of both origination and secondary market activity, and the interconnectedness of the two. Unlike self-reported survey data, Optimal Blue’s direct-source data accurately reflect the in-process loans in lenders’ pipelines and secondary market executions. Visit Optimal Blue’s website to subscribe to receive the free report each month.

Nothing herein shall be construed as, nor is Optimal Blue providing, any legal, trading, hedging, or financial advice.

About Optimal Blue

Optimal Blue powers profitability across the mortgage capital markets ecosystem. As the industry’s only end-to-end capital markets platform, our technology, data and integrations bridge the primary and secondary markets to help lenders of all sizes maximize performance – from pricing accuracy to margin protection and every step in between. Backed by over 20 years of proven expertise, our modern, cloud-native technology delivers the real-time automation, actionable data and seamless connectivity lenders need to navigate market volatility and scale for growth. To learn more about how Optimal Blue delivers measurable ROI, visit OptimalBlue.com.

MULTIMEDIAL

Image link for media: https://www.Send2Press.com/300dpi/25-0910-s2p-opbluaug25-300dpi.jpg

Image caption: Optimal Blue’s August 2025 Market Advantage mortgage data report

NEWS SOURCE: Optimal Blue


This press release was issued on behalf of the news source (Optimal Blue), who is solely responsible for its accuracy, by Send2Press Newswire. Image, if any, was provided by the news source and not this website or the wire service. Information is believed accurate, as provided by the news source, but is not guaranteed.

To view the original story, visit: https://www.send2press.com/wire/refinances-surge-nearly-70-as-purchase-activity-falls-10-in-august/

Copr. © 2025 Send2Press® Newswire, Calif., USA. -- REF: S2P STORY ID: S2P129198 NOREL-3B
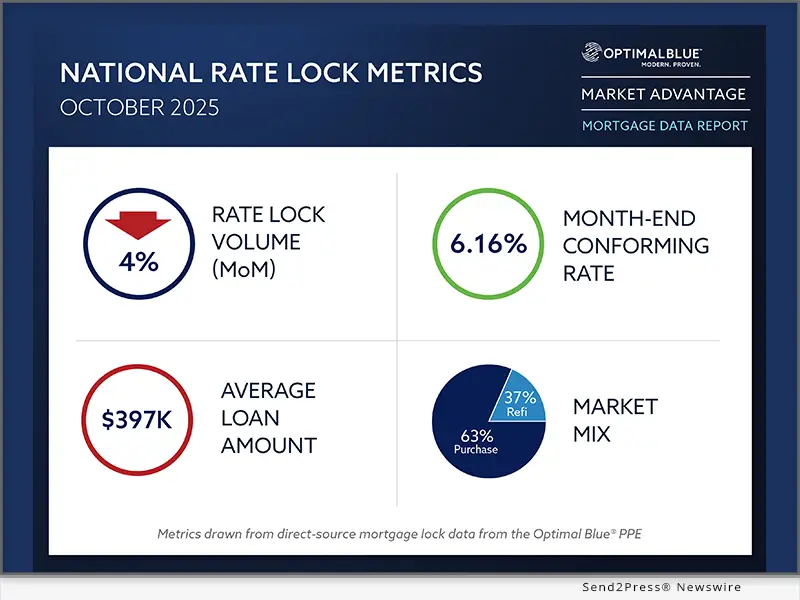
 

Strong Summer Showing with Another 143 New Industrial Manufacturing Planned Project for August 2025

The Industrial Manufacturing sector had 143 new projects in August, an increase from 141 projects in both June and July

JACKSONVILLE BEACH, Fla., Sept. 4, 2025 (SEND2PRESS NEWSWIRE) — Industrial SalesLeads has released its August 2025 MiR report on planned capital project spending in the Industrial Manufacturing sector. The firm tracks new capital projects across North America, including facility expansions, new plant construction, and equipment modernization projects.

Strong Summer Showing with Another 143 New Industrial Manufacturing Planned Project for August 2025
Image caption: Strong Summer Showing with Another 143 New Industrial Manufacturing Planned Project for August 2025.

KEY FINDINGS FROM THE REPORT SHOW THAT:

  • The Industrial Manufacturing sector had 143 new projects in August, an increase from 141 projects in both June and July.
  • The Distribution and Industrial Warehouse sector saw 72 new projects in August, an increase of 10.8% with 65 new projects in July.

The following are selected highlights on new Industrial Manufacturing industry construction news.

Industrial Manufacturing – By Project Type

  • Manufacturing/Production Facilities – 124 New Projects
  • Distribution and Industrial Warehouse – 72 New Projects

Industrial Manufacturing – By Project Scope/Activity

  • New Construction – 42 New Projects
  • Expansion – 34 New Projects
  • Renovations/Equipment Upgrades – 67 New Projects
  • Plant Closings – 15 New Projects

&

INDUSTRIAL MANUFACTURING – BY PROJECT LOCATION (TOP 10 STATES)

Michigan – 10

Indiana – 9

Florida – 7

Tennessee – 7

Alabama – 6

California – 6

Georgia – 6

New York – 6

Ohio – 6

Texas – 6

Massachusetts – 5

LARGEST PLANNED PROJECT

During the month of August, our research team identified 16 new Industrial Manufacturing facility construction projects with an estimated value of $100 million or more.

The largest project is owned by Hyundai Motor Group, who is planning to invest $13 billion for the expansion of their manufacturing facility at 700 Hyundai Blvd. in MONTGOMERY, AL. They are currently seeking approval for the project. Completion is slated for 2028.

TOP 10 TRACKED INDUSTRIAL MANUFACTURING PROJECTS

KENTUCKY:

Global computer and technology product mfr. is planning to invest $3 billion for the expansion, renovations, and equipment upgrades on a manufacturing facility in HARRODSBURG, KY. They are currently seeking approval for the project.

INDIANA:

Steel company is planning to invest $3 billion for the renovation and equipment upgrades on their manufacturing facility in GARY, IN. They are currently seeking approval for the project.

KENTUCKY:

Automotive mfr. is planning to invest $2 billion for the renovation and equipment upgrades on their manufacturing facility in LOUISVILLE, KY. Completion is slated for Spring 2027.

NORTH CAROLINA:

Electronic components mfr. is planning to invest $500 million for the renovation and equipment upgrades on a 422,000 sf manufacturing facility at 2121 Heilig Rd. in GRANITE QUARRY, NC. They have recently received approval for the project. Completion is slated for mid-2026.

ILLINOIS:

Solar panel mfr. is considering investing $300 million for the construction of a manufacturing and office facility in WAUKEGAN, IL. Watch SalesLeads for updates.

TEXAS:

Startup cloud-based electronics mfr. is planning to invest $229 million for the construction of a manufacturing, laboratory, and office facility at 4400 Alliance Gateway Fwy. in FORT WORTH, TX. Construction will occur in multiple phases, with completion of the first phase slated for late 2027.

ARIZONA:

Startup defense technology company is planning to invest $200 million for the renovation and equipment upgrades on a recently leased 270,000 sf manufacturing facility in MESA, AZ. Completion is slated for early 2026.

ILLINOIS:

Pharmaceutical company is planning to invest $195 million for the construction of a processing facility in NORTH CHICAGO, IL. Construction is expected to start in Fall 2025, with completion slated for 2027.

ARKANSAS:

PVC electrical component mfr. is planning to invest $120 million for the renovation and equipment upgrades on a recently acquired 351,000 sf manufacturing and warehouse facility at 630 Highway 27 Bypass in NASHVILLE, AR. Completion is slated for late 2025.

LOUISIANA:

Containerboard and corrugated box mfr. is planning to invest $119 million for the renovation and equipment upgrades on their manufacturing facility in ST. FRANCISVILLE, LA. They have recently received approval for the project. Completion is slated for Summer 2027.

ABOUT INDUSTRIAL SALESLEADS, INC.

Since 1959, Industrial SalesLeads, based in Jacksonville, FL is a leader in delivering industrial capital project intelligence and prospecting services for sales and marketing teams to ensure a predictable and scalable pipeline. Our Industrial Market Intelligence, IMI identifies timely insights on companies planning significant capital investments such as new construction, expansion, relocation, equipment modernization and plant closings in industrial facilities. The Outsourced Prospecting Services, an extension to your sales team, is designed to drive growth with qualified meetings and appointments for your internal sales team. Visit us at salesleadsinc.com.

Each month, our team provides hundreds of industrial reports within a variety of industries, including:

https://www.salesleadsinc.com/industry/industrial-manufacturing/

NEWS SOURCE: Industrial SalesLeads Inc


This press release was issued on behalf of the news source (Industrial SalesLeads Inc), who is solely responsible for its accuracy, by Send2Press Newswire. Image, if any, was provided by the news source and not this website or the wire service. Information is believed accurate, as provided by the news source, but is not guaranteed.

To view the original story, visit: https://www.send2press.com/wire/strong-summer-showing-with-another-143-new-industrial-manufacturing-planned-project-for-august-2025/

Copr. © 2025 Send2Press® Newswire, Calif., USA. -- REF: S2P STORY ID: S2P129087 NOREL-3B
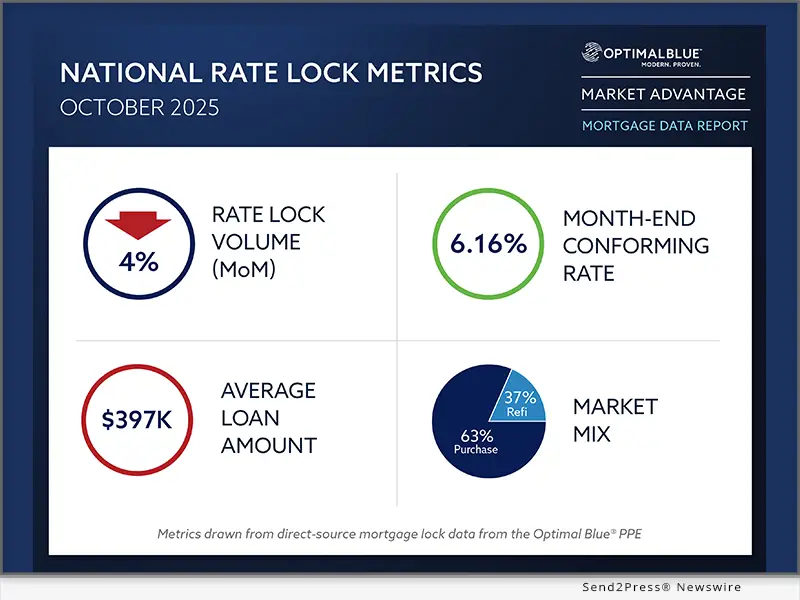
 

ACES Q1 2025 Mortgage QC Industry Trends Report reveals early signs of loan quality risk amidst mounting market pressures

Defect rate increases from historic low as underwriting pressures, shifting borrower profiles and market volatility test lenders' quality control processes

DENVER, Colo., Aug. 20, 2025 (SEND2PRESS NEWSWIRE) — ACES Quality Management® (ACES), the leading provider of enterprise quality management and control software for the financial services industry, today announced the release of its quarterly ACES Mortgage QC Industry Trends Report covering the first quarter (Q1) of 2025. The latest report analyzes post-closing quality control data derived from ACES Quality Management & Control® software.

ACES Quality Management
Image caption: ACES Quality Management logo.

Notable findings from the Q1 2025 report include the following:

  • The overall critical defect rate rose 12.93% to 1.31%, ending a two-quarter improvement streak.
  • Income/Employment defects increased 42.5%, reclaiming the top spot at 22.99% of all critical defects.
  • Borrower and Mortgage Eligibility defects surged 328.57% quarter-over-quarter, while Credit defects rose 11.96%.
  • Assets, Legal/Regulatory/Compliance, and Appraisal categories posted significant improvements.
  • Refinance defect share increased despite a drop in review volume, while purchase defect share declined.

“The rise in critical defects this quarter underscores how market volatility and operational pressure can impact loan quality,” said Nick Volpe, executive vice president at ACES Quality Management. “At the same time, we’re seeing that lenders who invest in automation and proactive quality control are making measurable improvements, particularly in underwriting and compliance.”

Findings for the Q1 ACES Mortgage QC Industry Trends Report are based on post-closing quality control data derived from the ACES Quality Management and Control® benchmarking system and incorporate data from prior quarters and/or calendar years, where applicable. All reviews and defect data evaluated for the report were based on loan audits selected by lenders for full file reviews. The Mortgage QC Industry Trends Reports are available for download, free of charge, at https://www.acesquality.com/resources/reports.

About ACES Quality Management

ACES Quality Management is the leading provider of enterprise quality management and control software for the financial services industry. The nation’s most prominent lenders, servicers and financial institutions rely on ACES Quality Management & Control® Software to improve audit throughput and quality while controlling costs, including:

  • Over 70% of the top 20 independent mortgage lenders;
  • 7 of the top 10 loan servicers;
  • 11 of the top 30 banks; and
  • 3 of the top 5 credit unions in the United States.

Unlike other quality control platforms, ACES Flexible Audit Technology® gives independent mortgage lenders and financial institutions the ability to easily manage and customize ACES to meet their business needs without having to rely on IT or other outside resources. Using a customer-centric approach, ACES clients get responsive support and access to our experts to maximize their investment. For more information, visit https://www.acesquality.com/ or call 1-800-858-1598.

LOGO link for media: https://www.acesquality.com/assets/images/aces-logo.svg

NEWS SOURCE: ACES Quality Management


This press release was issued on behalf of the news source (ACES Quality Management), who is solely responsible for its accuracy, by Send2Press Newswire. Image, if any, was provided by the news source and not this website or the wire service. Information is believed accurate, as provided by the news source, but is not guaranteed.

To view the original story, visit: https://www.send2press.com/wire/aces-q1-2025-mortgage-qc-industry-trends-report-reveals-early-signs-of-loan-quality-risk-amidst-mounting-market-pressures/

Copr. © 2025 Send2Press® Newswire, Calif., USA. -- REF: S2P STORY ID: S2P128618 NOREL-3B
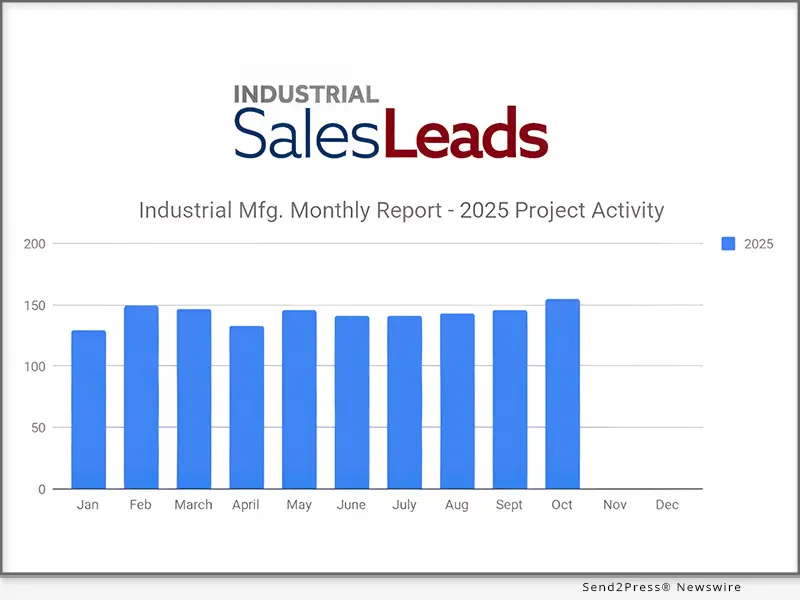
 

Steady Summer for Industrial Manufacturing with 141 New Projects Recorded in June and Again July 2025

JACKSONVILLE BEACH, Fla., Aug. 14, 2025 (SEND2PRESS NEWSWIRE) — Industrial SalesLeads reports a consistent summer for the industrial manufacturing sector, with 141 new capital projects announced in both June and July 2025. The Firm’s monthly report, which tracks planned new capital projects including new plant construction, facility expansions, and major equipment modernization projects across North America, confirms this consistent level of activity. This sustained growth indicates a strong and stable period of planned capital spending within the industry.

Steady Summer for Industrial Manufacturing with 141 New Projects Recorded in June and Again July 2025
Image caption: Steady Summer for Industrial Manufacturing with 141 New Projects Recorded in June and Again July 2025.

The following are selected highlights on new Industrial Manufacturing industry construction news.

Industrial Manufacturing – By Project Type

  • Manufacturing/Production Facilities – 130 New Projects
  • Distribution and Industrial Warehouse – 65 New Projects

Industrial Manufacturing – By Project Scope/Activity

  • New Construction – 32 New Projects
  • Expansion – 48 New Projects
  • Renovations/Equipment Upgrades – 71 New Projects
  • Plant Closings – 14 New Projects

INDUSTRIAL MANUFACTURING – BY PROJECT LOCATION (TOP 10 STATES)

Texas – 14

South Carolina – 11

Indiana – 10

Wisconsin – 9

California – 8

Michigan – 8

New York – 8

Pennsylvania – 7

Tennessee – 7

North Carolina – 6

Kentucky – 5

LARGEST PLANNED PROJECT

During the month of July, our research team identified 14 new Industrial Manufacturing facility construction projects with an estimated value of $100 million or more.

The largest project is owned by AstraZeneca, who is considering investing $4 billion for the construction of a processing facility and currently seeking a site in VIRGINIA. Watch SalesLeads for updates.

TOP 10 TRACKED INDUSTRIAL MANUFACTURING PROJECTS

NORTH CAROLINA:

Biotechnology company is planning to invest $2 billion for the expansion and equipment upgrades on their processing facility in RESEARCH TRIANGLE PARK, NC. They are currently seeking approval for the project.

TEXAS:

Electronic component mfr. is planning to invest $687 million for the construction of two manufacturing facilities at 15200 Heritage Pkwy and 14601 Mobility Way in FORT WORTH, TX. They have recently received approval for the project. Completion is slated for late 2026.

KENTUCKY:

Home appliance mfr. is planning to invest $490 million for the expansion, renovation, and equipment upgrades on their manufacturing facility in LOUISVILLE, KY. They are currently seeking approval for the project. Completion is slated for 2027.

MISSISSIPPI:

Transformer mfr. is planning to invest $236 million for a 580,000 sf expansion and equipment upgrades on their manufacturing facility in QUITMAN, MS. The project includes the expansion of their manufacturing facilities in LAUREL, MS, and MEDENHALL, MS. They are currently seeking approval for the project.

TEXAS:

Solar panel mfr. is planning to invest $200 million for the expansion and equipment upgrades on their manufacturing facility in BROOKSHIRE, TX. They are currently seeking approval for the project.

ARKANSAS:

Defense contractor is planning to invest $193 million for a 130,000 sf expansion of their manufacturing and office campus in CAMDEN, AR. They are currently seeking approval for the project. Completion is slated for 2027.

VIRGINIA:

Custom automotive mfr. is considering investing $150 million for the renovation and equipment upgrades on a manufacturing facility at 701 S. 6th Ave. in HOPEWELL, VA. Watch SalesLeads for updates.

MISSISSIPPI:

Federal space agency is planning to invest $120 million for the renovation and equipment upgrades on their manufacturing facility in HANCOCK COUNTY, MS. They are currently seeking approval for the project.

PENNSYLVANIA:

Energy equipment mfr. is planning to invest $100 million for the expansion of their manufacturing facility in CHARLEROI, PA. They are currently seeking approval for the project.

NORTH CAROLINA:

Biodegradable paper tableware mfr. is planning to invest $80 million for the renovation and equipment upgrades on a 588,000 sf manufacturing and warehouse facility at 68 Snowbird Rd. in ROBBINSVILLE, NC. They have recently received approval for the project.

About Industrial SalesLeads, Inc.

Since 1959, Industrial SalesLeads, based in Jacksonville, FL is a leader in delivering industrial capital project intelligence and prospecting services for sales and marketing teams to ensure a predictable and scalable pipeline. Our Industrial Market Intelligence, IMI identifies timely insights on companies planning significant capital investments such as new construction, expansion, relocation, equipment modernization and plant closings in industrial facilities. The Outsourced Prospecting Services, an extension to your sales team, is designed to drive growth with qualified meetings and appointments for your internal sales team. Visit us at salesleadsinc.com.

Each month, our team provides hundreds of industrial reports within a variety of industries, including:

https://www.salesleadsinc.com/blog/

NEWS SOURCE: Industrial SalesLeads Inc


This press release was issued on behalf of the news source (Industrial SalesLeads Inc), who is solely responsible for its accuracy, by Send2Press Newswire. Image, if any, was provided by the news source and not this website or the wire service. Information is believed accurate, as provided by the news source, but is not guaranteed.

To view the original story, visit: https://www.send2press.com/wire/steady-summer-for-industrial-manufacturing-with-141-new-projects-recorded-in-june-and-again-july-2025/

Copr. © 2025 Send2Press® Newswire, Calif., USA. -- REF: S2P STORY ID: S2P128465 NOREL-3B
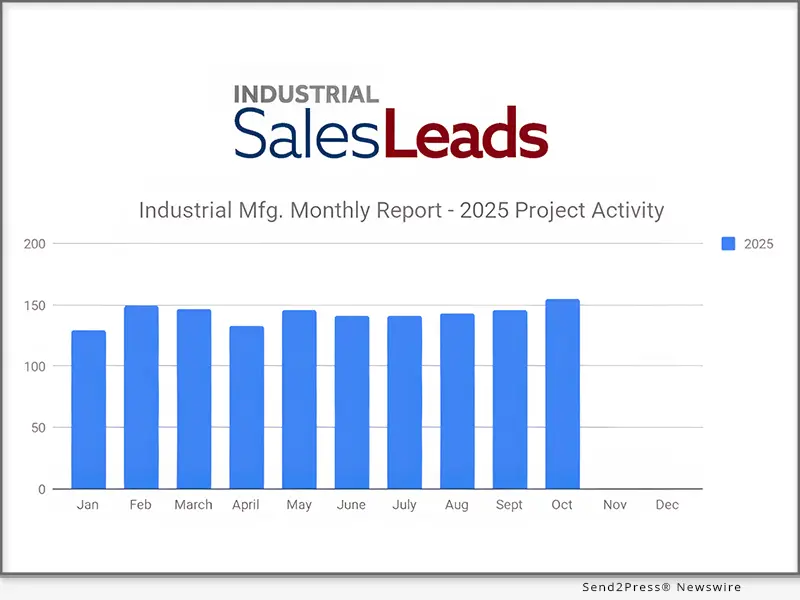
 

Refinances tick up and non-QM hits record high as purchase activity falls nearly 5% in July

Lenders respond to affordability pressures with loan product diversity and pricing strategies

PLANO, Texas, Aug. 12, 2025 (SEND2PRESS NEWSWIRE) — Optimal Blue today released its July 2025 Market Advantage mortgage data report, which found a 3% month-over-month (MoM) drop in overall rate lock volume, led by a nearly 5% drop in purchase activity as affordability remained strained.

Optimal Blue’s July 2025 Market Advantage mortgage data report
Image caption: Optimal Blue’s July 2025 Market Advantage mortgage data report.

Mortgage rates rose MoM across all loan types. The OBMMI 30-year conforming fixed rate, the benchmark for CME Group’s Mortgage Rate futures, ended July at 6.72%, up 5 basis points (bps). FHA, VA and jumbo rates also ticked up, rising 3, 4 and 11 bps respectively to 6.50%, 6.33% and 6.89%.

While purchase volume held steady year-over-year (YoY), refinancing showed renewed strength in July. Cash-out and rate-and-term refinance locks rose 5% and 7% respectively, partially offsetting the broader softness in the purchase market.

“As we near the end of peak buying season, 2025 purchase activity has largely tracked with 2024,” said Mike Vough, head of corporate strategy at Optimal Blue. “With affordability still a major constraint, purchase volume in line with 2024 is generally a disappointment to the industry based on 2025 projections We’re seeing more cash-out (+27% annually) and rate-and-term (+13% annually) opportunities as borrowers with post-2022 loans respond to even modest rate improvements, and borrowers may be undergoing some financial stress based on cash-out increases.”

Non-QM lending reached a new milestone in July, accounting for 8% of total rate lock volume – the highest on record. At the same time, GSE-eligible originations fell to 52.2% and non-conforming lending rose to 16.8%, underscoring a market shift toward nontraditional financing solutions. This can be attributed to elevated rates, increased debt, growing openness to alternative forms of income verification, and conventional loan limits, which are prompting more borrowers to seek flexible qualification paths.

“There’s growing separation in the ways larger and smaller lenders are managing profitability,” Vough added. “We saw an uptick in agency MBS executions, insinuating more market share is going to depositories and large IMBs, alongside stronger bid-to-cover ratios, indicating lenders are chasing the highest price over other execution considerations. Combined with deeper engagement in OBMMI-tied CME futures and many conversations about capital markets strategies for non-agency loans, it’s clear lenders are being proactive in their pricing, margin and pipeline risk strategies.”

Key findings from the Market Advantage report, derived from direct-source mortgage lock and secondary market data, include:

Volume trends and market composition

  • Volume down: Total locks declined 3% MoM in July, driven primarily by a 5% drop in purchase activity and reflecting ongoing affordability challenges.
  • Refinance share increases: Although only 20% of the market, refis are gaining traction as borrowers with post-2022 loans find opportunities to lower monthly payments. Cash-out and rate-and-term refis rose 5% and 7%, respectively.
  • PUD volume rises: Planned unit development (PUD) activity grew 0.85% to 28.5% of all production, while single-family homes declined by 0.87% to 63.5%. Despite the monthly increase, new construction market share is down 4% YoY, pointing to a broader builder pullback.

Rates and pricing

  • Benchmark rates climb: The OBMMI ended July at 6.72%, up 5 bps after dipping to ~6.625% earlier in the month. FHA rose 3 bps to 6.50%, VA increased 4 bps to 6.33% and jumbo jumped 11 bps to 6.89%.
  • MSRs dip: Mortgage servicing rights (MSRs) for conforming 30-year loans fell 3 bps to 1.19, moving in counter to OBMMI, but impacted by increases in intramonth volatility.
  • Futures activity rises: CME futures tied to the OBMMI are attracting increased interest from MSR holders and pipeline hedgers seeking to manage rate risk. MSR values tend to fluctuate with interest rate expectations, and recent activity suggests growing demand for tools that help mitigate exposure.

Channel and execution

  • Conventional share slips: The GSE-eligible share declined 0.78% to 52.2%, while non-conforming originations (including jumbo and non-QM) rose 0.62% to 16.8%. FHA, VA and USDA volumes remained flat MoM.
  • Hedged loan sales shift: Sales to the agency cash window fell 200 bps to 26%, while agency mortgage-backed security (MBS) executions rose to 37%, reflecting stronger securitization activity among large lenders and potential for market share increase from this cohort.
  • Loan sales favor higher pricing tiers: The share of loans sold at the highest price rose to 70% (+100 bps), while loans sold in the fourth tier or worse fell to 11% (-100 bps), suggesting that eligibility exceptions and representative delivery profiles played a smaller role in pricing decisions than in prior months.

Product mix and borrower profiles

  • Non-QM reaches record: The share of non-QM loans hit 8% of total volume for the first time, with investor/DSCR at 29%, bank statement loans at 34% and other non-traditional income documentation methods at 38%.
  • ARMs gain: Adjustable-rate mortgages (ARMs) rose to 9.52% of overall volume in July, up from 8.81% in June, despite the SOFR curve flattening with the 2-year/10-year spread dropping ~ 7 bps, but remaining positively sloped.
  • Average credit scores: Conforming FICO scores fell 1 point to 756, and FHA scores dropped to 675, while VA remained flat at 713.
  • Loan amounts dip: The average loan amount was $382,476, down from $386,084 in June. Of the top 30 MSAs, average loan amounts ranged from a high of $609,008 in the New York region to a low of $476,637 in Sacramento, California.

To view the full July 2025 Market Advantage report, complete the free subscription form: https://engage.optimalblue.com/market-advantage. Subscribers receive a report PDF each month with the latest data. Members of the press are eligible for special, advance access each month and should contact Olivia DeLancey to be added to the media list.

This month’s Market Advantage podcast features Julian Hebron, founder of The Basis Point. Access the podcast: https://market-advantage.captivate.fm/episode/episode-11.

About the Market Advantage Report

Optimal Blue issues the Market Advantage mortgage report each month to provide insight into U.S. mortgage trends and drivers of lending profitability. Data is sourced from the Optimal Blue PPE, which is used to price and lock more than one-third of all mortgages nationwide, and Optimal Blue’s hedging and loan trading system, which supports approximately 40% of loans hedged and sold into the secondary market. As the leader in mortgage capital markets technology, Optimal Blue has a direct view of both origination and secondary market activity, and the interconnectedness of the two. Unlike self-reported survey data, Optimal Blue’s direct-source data accurately reflect the in-process loans in lenders’ pipelines and secondary market executions. Visit Optimal Blue’s website to subscribe to receive the free report each month.

Nothing herein shall be construed as, nor is Optimal Blue providing, any legal, trading, hedging, or financial advice.

About Optimal Blue

Optimal Blue powers profitability across the mortgage capital markets ecosystem. As the industry’s only end-to-end capital markets platform, our technology, data, and integrations bridge the primary and secondary markets to help lenders of all sizes maximize performance – from pricing accuracy to margin protection and every step in between. Backed by over 20 years of proven expertise, our modern, cloud-native technology delivers the real-time automation, actionable data, and seamless connectivity lenders need to navigate market volatility and scale for growth. To learn more about how Optimal Blue delivers measurable ROI, visit OptimalBlue.com.

MULTIMEDIA:

Image link for media https://www.Send2Press.com/300dpi/25-0812-s2p-opblue-july-300dpi.jpg

Image caption: Optimal Blue’s July 2025 Market Advantage mortgage data report.

NEWS SOURCE: Optimal Blue


This press release was issued on behalf of the news source (Optimal Blue), who is solely responsible for its accuracy, by Send2Press Newswire. Image, if any, was provided by the news source and not this website or the wire service. Information is believed accurate, as provided by the news source, but is not guaranteed.

To view the original story, visit: https://www.send2press.com/wire/refinances-tick-up-and-non-qm-hits-record-high-as-purchase-activity-falls-nearly-5-in-july/

Copr. © 2025 Send2Press® Newswire, Calif., USA. -- REF: S2P STORY ID: S2P128390 NOREL-3B