Tag Archives: Market Advantage mortgage data report

Optimal Blue report: Purchase demand rebounds as mortgage market finds balance

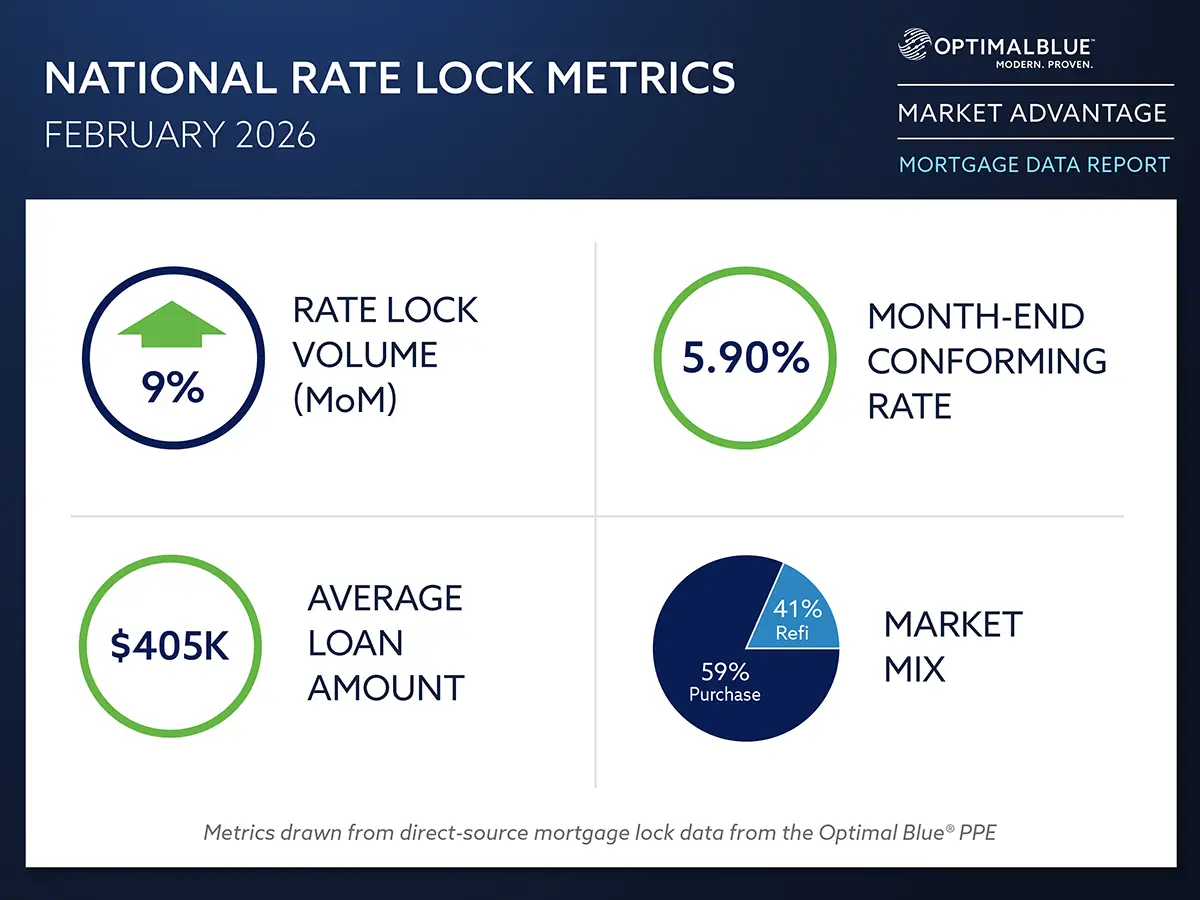
Lock volume rises 9% month over month and nearly 40% year over year as lower rates draw borrowers back into the market

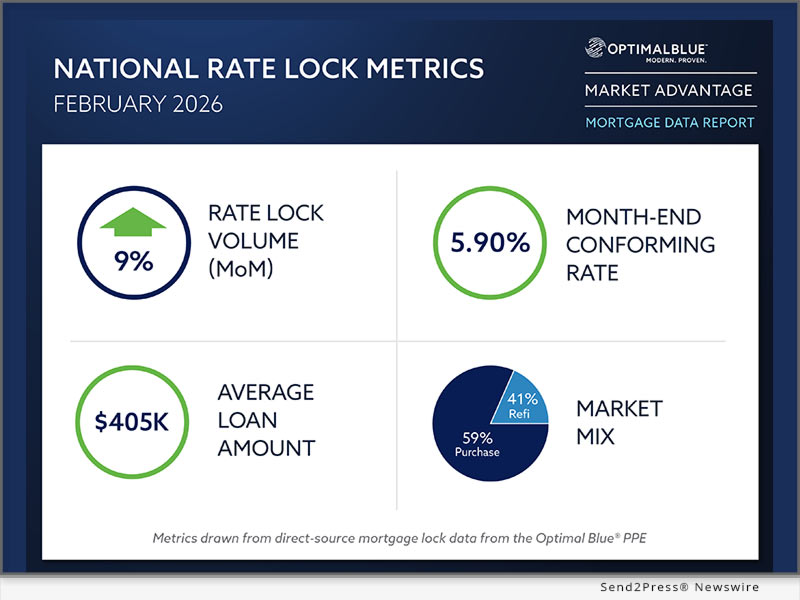
PLANO, Texas, March 10, 2026 (SEND2PRESS NEWSWIRE) — Optimal Blue today released its February 2026 Market Advantage mortgage data report, showing a meaningful improvement in lock activity as lower mortgage rates helped bring purchase borrowers back into the market. Total rate-lock volume rose 9% month over month (MoM) and was nearly 40% higher year over year (YoY). Purchase lock volume increased more than 14% from January and 5% compared with February 2025, driving refinance share down to 41% of locks from 44% in January. Rate-and-term and cash-out refinance activity edged modestly higher from January but remained sharply stronger YoY.
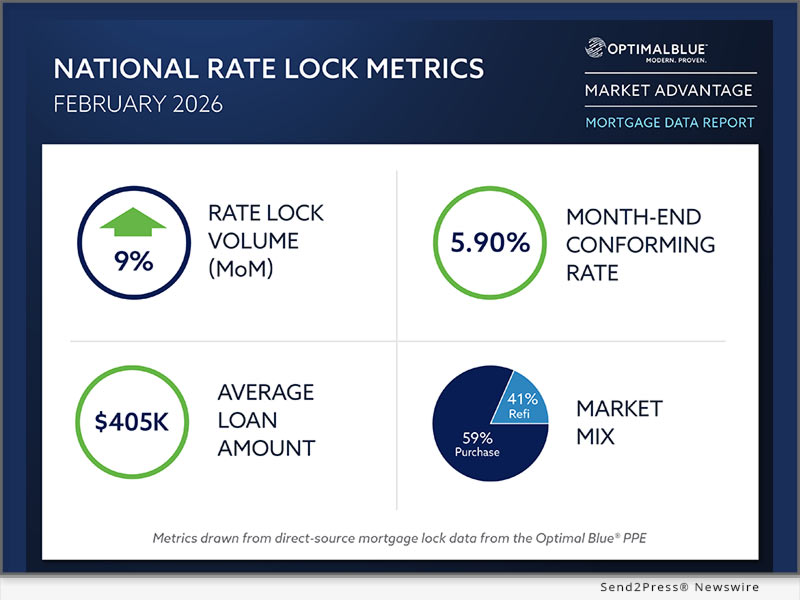
Optimal Blue’s February 2026 Market Advantage mortgage data report
Image caption: Optimal Blue’s February 2026 Market Advantage mortgage data report.

Mortgage rates declined across all major products in February. The OBMMI 30-year conforming fixed rate, the benchmark for CME Group’s Mortgage Rate futures, finished the month at 5.90%, down 17 basis points (bps) from January. Jumbo and VA rates each declined 11 bps during the month, while FHA rates fell 13 bps. The 10-year Treasury yield closed the month at 3.97%, down nearly 30 bps, and the spread between the 10-year Treasury and the OBMMI 30-year rate widened to 193 bps as the mortgage rally lagged the broader bond market.

“February’s data shows the market settling into a healthier balance between purchase and refinance activity as rates moved lower,” said Mike Vough, senior vice president of corporate strategy at Optimal Blue. “Purchase demand is back after a slow start to the year, but refinance share is still running at 41%, which is higher than anything we saw between early 2022 and late last year.”

Secondary market data in February pointed to shifting execution dynamics as pricing spreads widened and delivery strategies evolved. Best-efforts-to-mandatory spreads widened for conventional products while hedged loan sales moved toward the agency cash window. At the same time, agency mortgage-backed securities (MBS) securitization declined and mortgage servicing rights (MSR) values increased despite falling benchmark rates.

“In an environment like this, lenders are paying close attention to how they execute and manage risk,” said Vough. “We’re seeing more active positioning across delivery channels and servicing assets as lenders balance near-term pricing with longer-term portfolio value.”

Key findings from the Market Advantage report, derived from direct-source mortgage lock and secondary market data, include:

Volume trends and market composition

  • Refinance activity remains strong: Refinances accounted for 41% of total lock volume in February, down from 44% in January, as purchase demand rebounded. Rate-and-term refinance locks increased 3% MoM and 280% YoY, while cash-out refinance volume rose 1% MoM and 34% YoY.
  • Purchase demand rebounds: Purchase lock volume rose 14% MoM and 5% YoY, marking a meaningful improvement from January’s slower start to the year and helping restore a more balanced mix between purchase and refinance activity.
  • Non-conforming share expands: Conforming loans represented 53% of total lock volume in February, down 28 bps MoM but up 62 bps YoY. Non-conforming share increased to 16%, rising 91 bps MoM and 90 bps YoY. FHA loans accounted for 17% of locks, VA loans for 13% and USDA loans for 1%.
  • ARM utilization rises: Adjustable-rate mortgages comprised 10% of total lock volume in February, up 111 bps MoM and 337 bps YoY from 6.9% last year.

Rates and pricing

  • Rates move lower: The OBMMI 30-year conforming fixed rate declined 17 bps to 5.90%. Jumbo and VA rates each fell 11 bps, while FHA rates declined 13 bps. The 10-year Treasury yield declined nearly 30 bps to 3.97%, while the mortgage-to-Treasury spread widened to 193 bps.
  • MSR values increase: Mortgage servicing rights for conforming 30-year loans rose 2 bps to 1.18%, representing a 4.74 multiple, even as benchmark mortgage rates declined during the month.
  • Spreads adjust across products: Best-efforts-to-mandatory spreads widened for conventional products, with the conforming 30-year spread increasing 3 bps and the conventional 15-year spread rising 1 bp. The government 30-year spread decreased 5 bps.
  • Loan pricing mix shifts slightly: The share of loans sold at the highest price tier declined 100 bps to 78%, while second-tier executions increased 100 bps to 13%.

Channel and execution

  • Securitization share pulls back: Agency MBS securitizations accounted for 42% of hedged executions in February, down from 47% in January.
  • Cash window share jumps: Hedged loan sales to the agency cash window rose 500 bps MoM to 29%, the largest share of cash window deliveries since February 2025.

Product mix and borrower profiles

  • Credit profiles diverge: Purchase FICO scores averaged 734 in February, down 1 point MoM and 3 points YoY. Refinance credit profiles strengthened, with cash-out scores averaging 705 (up 1 point MoM and 10 points YoY) and rate-and-term scores averaging 749 (up 2 points MoM and 18 points YoY).
  • Loan amounts climb: The national average loan amount increased from $400,667 in January to $404,586 in February, marking the first time the average has remained above $400,000 for consecutive months. The national average loan-to-value ratio was 80.32%. Loan amounts ranged from $875,787 in the San Francisco Bay area to $319,743 in San Antonio, with regional LTVs spanning from 68.45% in the Bay area to 89.38% in San Antonio.

To view the full February 2026 Market Advantage report, complete the free subscription form: https://engage.optimalblue.com/market-advantage.

Subscribers receive a report PDF each month with the latest data. Members of the press are eligible for special, advance access each month and should contact Leslie Colley to be added to the media list.

About the Market Advantage Report

Optimal Blue issues the Market Advantage mortgage report each month to provide insight into U.S. mortgage trends and drivers of lending profitability. Data is sourced from the Optimal Blue PPE, which is used to price and lock more than one-third of all mortgages nationwide, and Optimal Blue’s hedging and loan trading system, which supports approximately 40% of loans hedged and sold into the secondary market. As the leader in mortgage capital markets technology, Optimal Blue has a direct view of both origination and secondary market activity and the interconnectedness of the two. Unlike self-reported survey data, Optimal Blue’s direct-source data accurately reflect the in-process loans in lenders’ pipelines and secondary market executions. Visit Optimal Blue’s website to subscribe to receive the free report each month.

Nothing herein shall be construed as, nor is Optimal Blue providing, any legal, trading, hedging or financial advice.

About Optimal Blue

Optimal Blue powers profitability across the mortgage capital markets ecosystem. As the industry’s only end-to-end capital markets platform, our technology, data and integrations bridge the primary and secondary markets to help lenders of all sizes maximize performance – from pricing accuracy to margin protection and every step in between. Backed by over 20 years of proven expertise, our modern, cloud-native technology delivers the real-time automation, actionable data and seamless connectivity lenders need to navigate market volatility and scale for growth. To learn more about how Optimal Blue delivers measurable ROI, visit OptimalBlue.com.

MULTIMEDIA

Image link for media: https://www.Send2Press.com/300dpi/26-0310-s2p-opblufeb26mk-300dpi.webp

Image caption: Optimal Blue’s February 2026 Market Advantage mortgage data report.

NEWS SOURCE: Optimal Blue


This press release was issued on behalf of the news source (Optimal Blue), who is solely responsible for its accuracy, by Send2Press Newswire. Image, if any, was provided by the news source and not this website or the wire service. Information is believed accurate, as provided by the news source, but is not guaranteed.

To view the original story, visit: https://www.send2press.com/wire/optimal-blue-report-purchase-demand-rebounds-as-mortgage-market-finds-balance/

Copr. © 2026 Send2Press® Newswire, Calif., USA. -- REF: S2P STORY ID: S2P133788 NOREL-3B
 

Optimal Blue report: Lock volume posts strongest November since 2021

Resilient refinance demand driven by current rates tempers the effects of seasonal slowdown

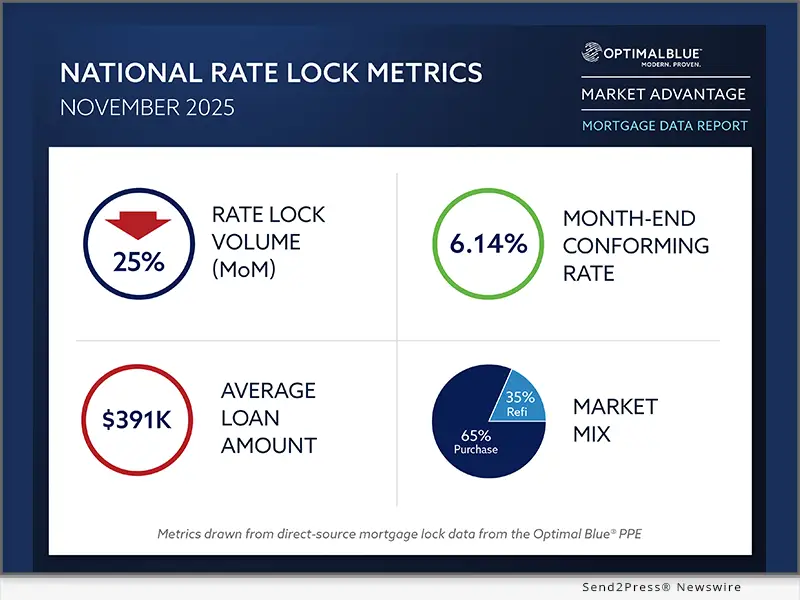
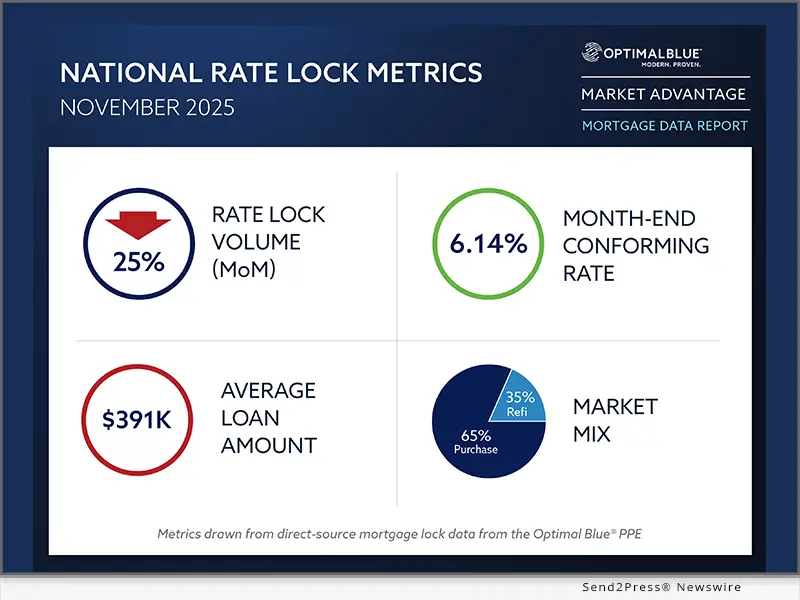
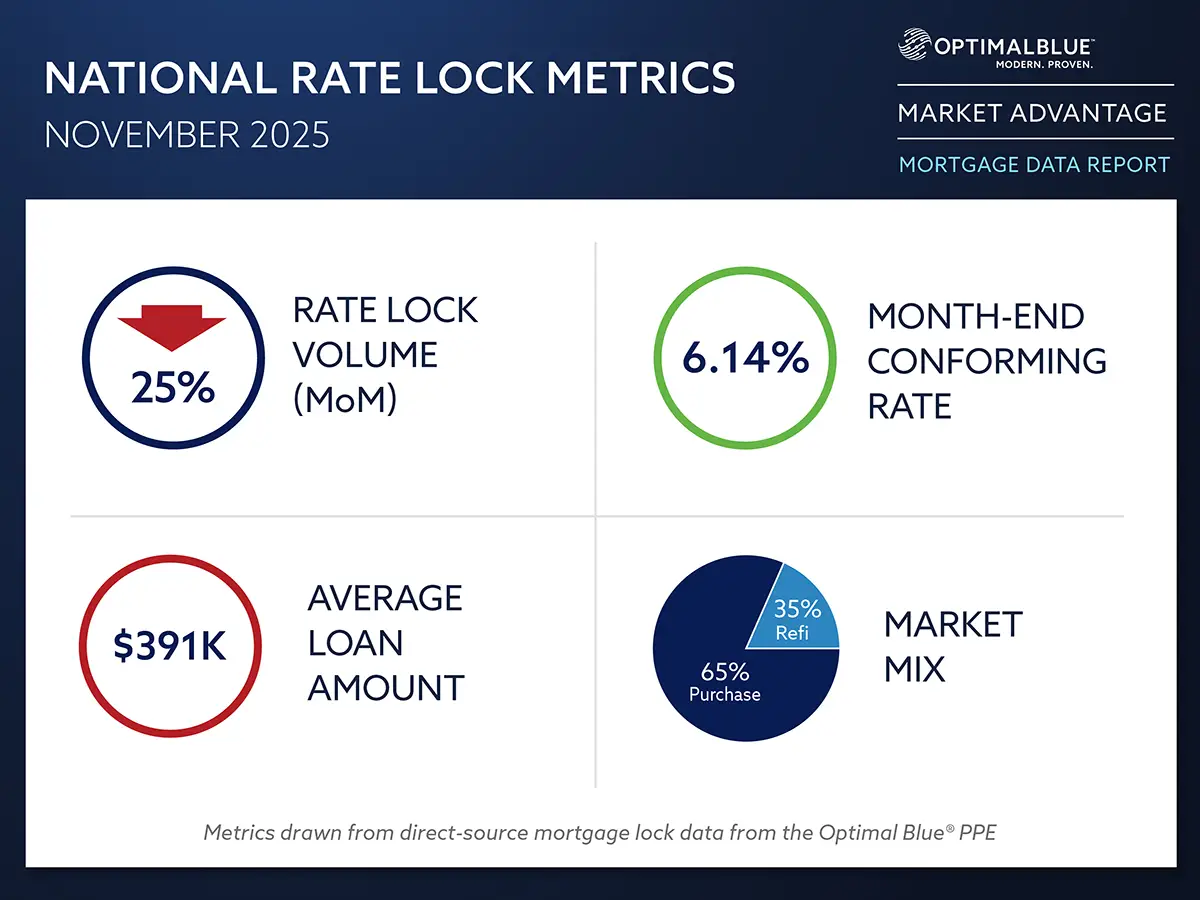
PLANO, Texas, Dec. 10, 2025 (SEND2PRESS NEWSWIRE) — Optimal Blue today released its November 2025 Market Advantage mortgage data report, which found that total mortgage rate-lock activity declined with normal late fall seasonality, yet still marked the strongest November in four years. Total lock volume fell 25% month over month (MoM) from October but remained up 17% year over year (YoY), buoyed by historically strong refinance demand and mortgage rates holding near 6%. Rate-and-term refinances continued to outperform 2024 levels by a wide margin, finishing November up 223% YoY despite easing from September’s high. Cash-out refinances rose 29% YoY. Purchase lock activity declined 22% MoM in line with seasonal patterns and slipped 6% YoY as elevated home costs and limited inventory continued to restrain demand.

Optimal Blue's November 2025 Market Advantage mortgage data report
Image caption: Optimal Blue’s November 2025 Market Advantage mortgage data report.

The Optimal Blue Mortgage Market Indices (OBMMI) 30-year conforming fixed rate, the benchmark for CME Group’s Mortgage Rate futures, dipped 1 basis point to 6.14% in November, marking a 53-bps improvement from the same period in 2024. FHA rates fell 5 bps to 5.99%, while VA and jumbo rates rose modestly to 5.76% (up 9 bps) and 6.44% (up 8 bps), respectively. The 10-year Treasury yield fell 11 bps to 4%, widening the mortgage rate spread by roughly 10 bps as OBMMI remained essentially flat.

“November’s data underscores a market still responding to rate relief even as seasonal patterns take hold,” said Mike Vough, senior vice president of corporate strategy at Optimal Blue. “Refinances remain the clear standout, with rate-and-term activity running more than triple last year’s levels and cash-outs continuing to outperform. It was a notably strong November by any measure.”

Lenders adjusted execution strategies in November as agency cash window sales rose 300 bps to 25%, interrupting the recent move toward greater securitization. Agency mortgage-backed securities (MBS) deliveries declined 100 bps to 45% after six consecutive months of gains, while bulk aggregator share dropped 300 bps to 27% and best-efforts executions increased 100 bps to 3%. The share of loans sold at the highest price tier fell 200 bps to 79%, while second- and fourth-tier deliveries increased. Mortgage servicing rights (MSRs) for conforming 30-year loans decreased 3 bps to 1.09% (a 4.36 multiple), in line with an average 15 bps decline across other OBMMI rate series.

“Execution strategies shifted meaningfully in November,” said Vough. “Lenders moved to the cash window as securitization momentum moderated, and pricing spreads broadened as more loans moved out of the top tier. These shifts point to lenders fine-tuning execution to manage price and overall delivery profile as the market settles into late-year conditions.”

Key findings from the Market Advantage report, derived from direct-source mortgage lock and secondary market data, include:

Volume trends and market composition

  • Refis remain a major driver: Refinances accounted for 35% of all locks. Rate-and-term refinances rose 223% YoY despite slowing from early fall peaks, while cash-out refinances increased 29% YoY.
  • Purchases decline: Purchase locks fell 22% MoM and 6% YoY as elevated home costs and limited listings continued to weigh on demand.
  • Non-QM sets new record: Non-qualified mortgage share rose to 9%, the highest level recorded by Optimal Blue, with investor/debt-service-coverage-ratio (DSCR) programs accounting for a growing share of non-QM production.
  • FHA, non-conforming pick up share: Product mix shifted toward FHA and non-conforming loans (including jumbo) at the expense of conforming and VA lending, supported in part by 5.99% FHA rates.
  • PUD share ticks up slightly: Planned unit development (PUD) lock share, a reasonable proxy for new construction, rose relative to other property types but remained well below last year’s unusually high levels.

Rates and pricing

  • Rates stabilize near 6%: The OBMMI 30-year conforming fixed rate ticked down 1 bp to 6.14%. FHA fell to 5.99%, while VA and jumbo rates rose to 5.76% and 6.44%, respectively.
  • MSR values dip: MSRs for conforming 30-year loans fell 3 bps to 1.09% (a 4.36 multiple), moving in line with rate declines.
  • Spread widens to 10-year Treasury: The 10-year Treasury yield fell 11 bps to 4%, widening the mortgage rate spread by roughly 10 bps as OBMMI remained mostly unchanged.
  • Pricing tiers show more dispersion: The share of loans sold at the highest price tier dropped 200 bps to 79%, while second- and fourth-tier shares rose.

Channel and execution

  • Cash window share increases: Cash window deliveries increased to 25% (up 300 bps) as lenders shifted execution away from aggregator and securitization outlets in November.
  • MBS share pulls back: Agency MBS sales fell to 45% (down 100 bps) after six consecutive months of increases.
  • Aggregator share declines: Bulk aggregator executions dropped to 27% (down 300 bps), while best-efforts executions rose to 3% (up 100 bps).

Product mix and borrower profiles

  • Lower-rate programs gain traction: Lenders saw greater uptake in products benefiting from improved pricing, including increased FHA share at 18.8% (up 104 bps) and steady demand for jumbo and other non-conforming offerings at 17% (up 34 bps).
  • S. buyer share rises: U.S. citizens accounted for nearly 94% of locks, extending a multi-month upward trend.
  • Credit scores and loan sizes edge lower: The average credit score fell one point to 733. The average loan amount decreased to $391,323 from October’s $397,438. November loan averages ranged from $592,129 in metro New York to $295,526 in Indianapolis. Average loan-to-value ratios ranged from 69.79% in Los Angeles to 88.22% in San Antonio.

To view the full November 2025 Market Advantage report, complete the free subscription form: https://engage.optimalblue.com/market-advantage. Subscribers receive a report PDF each month with the latest data. Members of the press are eligible for special, advance access each month and should contact Olivia DeLancey to be added to the media list.

About the Market Advantage Report

Optimal Blue issues the Market Advantage mortgage report each month to provide insight into U.S. mortgage trends and drivers of lending profitability. Data is sourced from the Optimal Blue PPE, which is used to price and lock more than one-third of all mortgages nationwide, and Optimal Blue’s hedging and loan trading system, which supports approximately 40% of loans hedged and sold into the secondary market. As the leader in mortgage capital markets technology, Optimal Blue has a direct view of both origination and secondary market activity and the interconnectedness of the two. Unlike self-reported survey data, Optimal Blue’s direct-source data accurately reflect the in-process loans in lenders’ pipelines and secondary market executions. Visit Optimal Blue’s website to subscribe to receive the free report each month.

Nothing herein shall be construed as, nor is Optimal Blue providing, any legal, trading, hedging or financial advice.

About Optimal Blue

Optimal Blue powers profitability across the mortgage capital markets ecosystem. As the industry’s only end-to-end capital markets platform, our technology, data and integrations bridge the primary and secondary markets to help lenders of all sizes maximize performance – from pricing accuracy to margin protection and every step in between. Backed by over 20 years of proven expertise, our modern, cloud-native technology delivers the real-time automation, actionable data and seamless connectivity lenders need to navigate market volatility and scale for growth. To learn more about how Optimal Blue delivers measurable ROI, visit OptimalBlue.com.

MULTIMEDIA

Image link for media: https://www.Send2Press.com/300dpi/25-1210-s2p-opbluenov-300dpi.webp

Image caption: Optimal Blue’s November 2025 Market Advantage mortgage data report

NEWS SOURCE: Optimal Blue


This press release was issued on behalf of the news source (Optimal Blue), who is solely responsible for its accuracy, by Send2Press Newswire. Image, if any, was provided by the news source and not this website or the wire service. Information is believed accurate, as provided by the news source, but is not guaranteed.

To view the original story, visit: https://www.send2press.com/wire/optimal-blue-report-lock-volume-posts-strongest-november-since-2021/

Copr. © 2025 Send2Press® Newswire, Calif., USA. -- REF: S2P STORY ID: S2P131605 NOREL-3B


Optimal Blue report: October lock volume holds second-highest level in three years

Seasonal cooling offset by resilient refinance demand and rising agency MBS executions

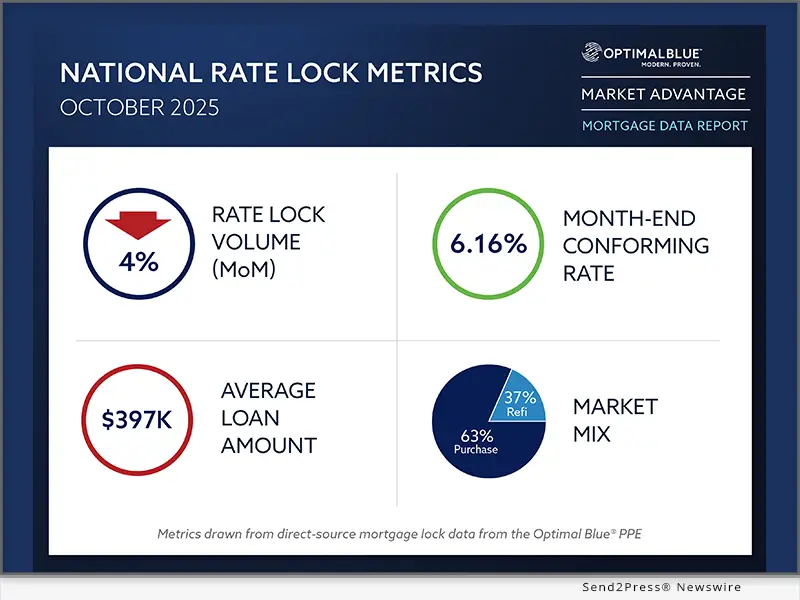
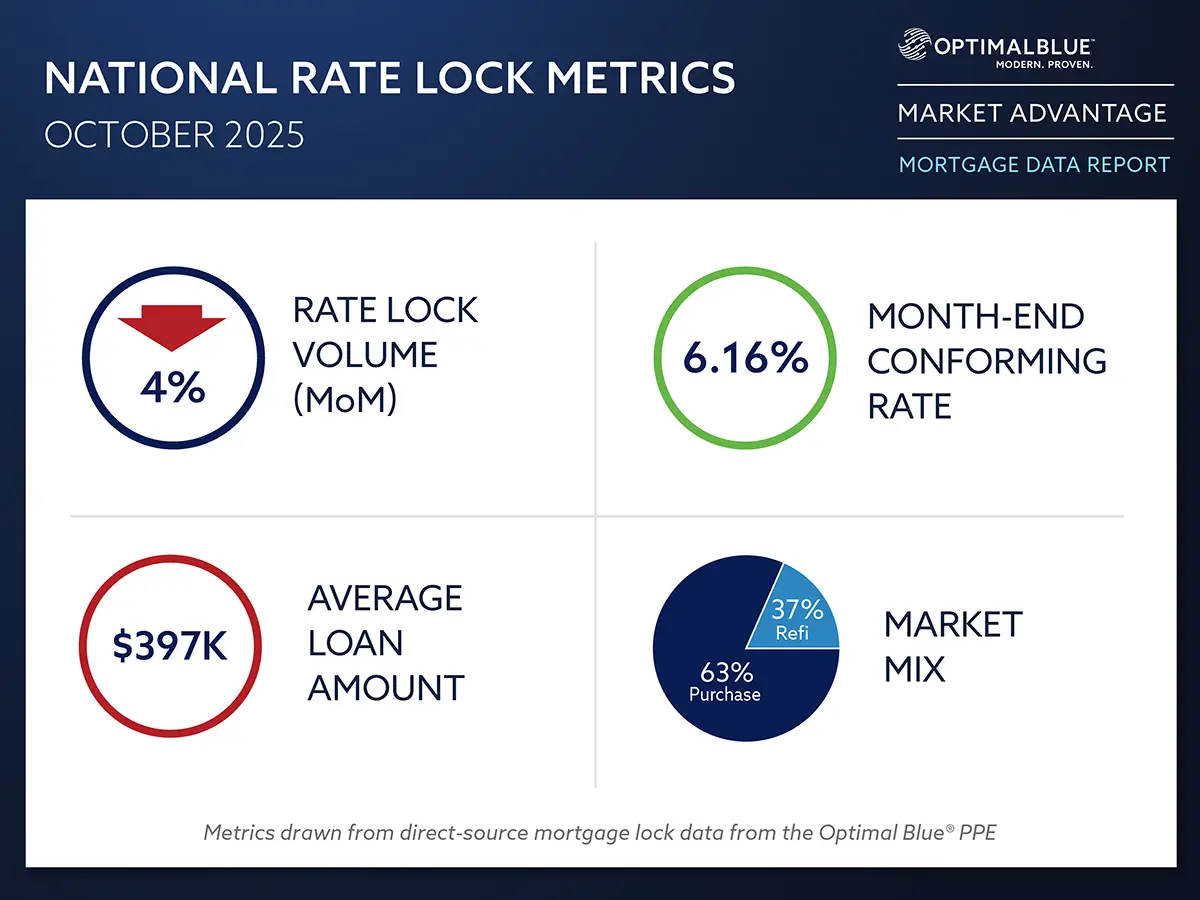
PLANO, Texas, Nov. 11, 2025 (SEND2PRESS NEWSWIRE) — Optimal Blue today released its October 2025 Market Advantage mortgage data report, showing that rate-lock activity remained strong despite seasonal cooling and continued to outpace last year’s levels. Total lock volume fell 4.2% month over month (MoM) from September’s peak but was still up 18% year over year (YoY) as borrowers responded to improving affordability and narrower rate spreads.

Optimal Blue's October 2025 Market Advantage mortgage data report.
Image caption: Optimal Blue’s October 2025 Market Advantage mortgage data report.

Purchase locks declined just 1.5% in October, in line with typical seasonal patterns, while refinance lending remained a key driver of activity. Rate-and-term refinances fell 14% from September but stayed up 143% YoY, and cash-out refinances rose 6% MoM and 29% YoY.

The Optimal Blue Mortgage Market Indices (OBMMI) 30-year conforming fixed rate – the benchmark for CME Group’s Mortgage Rate futures – dropped another 16 basis points (bps) to 6.16%, marking its lowest level since late 2023.

“October’s data speaks to the market’s resilience,” said Mike Vough, head of corporate strategy at Optimal Blue. “Purchase activity held steady and refinance demand – particularly cash-outs – remained strong. Even after September’s record pace, October delivered another standout month for originations.”

Lenders continued to strengthen execution strategies in the secondary market during October. Sales to agency mortgage-backed securities (MBS) climbed 400 bps to 46%, extending a multi-month trend of large-lender securitization growth. Deliveries to the agency cash window fell 200 bps to 30%, while aggregator bulk and best-efforts channels each dipped 100 bps. The share of loans sold at the highest price tier rose to 81%, up 300 bps, underscoring lenders’ ability to capture premium pricing even as servicing values tightened. Mortgage servicing rights (MSRs) for conforming 30-year loans increased 3 bps to 1.12% (a 4.47 multiple), moving in line with an average 6-bps gain across OBMMI rates for the month.

“October’s secondary market data reflected clear strength in execution,” said Vough. “Lenders leaned further into MBS sales and maintained access to top-tier pricing, signaling disciplined hedging and growing investor confidence. With securitization share and pricing quality both on the rise, large lenders appear well positioned to sustain profitability as production remains steady.”

Key findings from the Market Advantage report, derived from direct-source mortgage lock and secondary market data, include:

VOLUME TRENDS AND MARKET COMPOSITION

  • Refis stay elevated: Rate-and-term refinances fell 14% MoM but remained up 143% YoY, while cash-outs rose 6% MoM and 29% YoY. Refinance pull-through improved to 71.6%, up 11.4 points from September. Refinances accounted for 37% of all production in October, down 176 bps from September but up 11.4 points YoY.
  • Purchases steady: Purchase locks declined 1.5% aligned to seasonal expectations, remaining strong relative to historical patterns. Purchase pull-through improved to 84.6%, up 91 bps from September.
  • Non-QM share rises: Non-qualified mortgage share edged higher, driven by gains in both investor/debt-service-coverage-ratio (DSCR) and bank statement programs.
  • FHA and conforming gain share: FHA and conforming production increased at the expense of primarily VA lending. VA refinance activity typically reacts fastest to rate reductions, leading to a front-loading of VA locks in September.
  • Single-family share climbs: Single-family production rose relative to all other property types in October, reflecting sustained strength in owner-occupied lending.

RATES AND PRICING

  • Mortgage rates decline: The OBMMI 30-year conforming fixed rate fell 16 bps to 6.16%, with FHA at 6.04%, VA at 5.67% and jumbo at 6.36%.
  • Spread tightens to 10-year: The mortgage rate spread to the 10-year Treasury narrowed 11 bps to just over 200 bps, down 46 bps from 2024 and the tightest since early 2022. The 10-year yield itself fell only 5 bps to 4.11% as the Fed’s recent rate cut was largely priced into the market, indicating that most of the mortgage rate improvement stemmed from spread compression rather than a broader interest rate decline.
  • Lender pricing strengthens: Lenders achieved higher overall pricing levels in October as spreads narrowed and execution improved across delivery channels.
  • Servicing values recover: MSRs for conforming 30-year loans rose 3 bps to 1.12% (a 4.47 multiple).

CHANNEL AND EXECUTION

  • Agency MBS execution expands: Share rose to 46% (+400 bps), while the agency cash window share of execution fell to 30% (–200 bps) and aggregator bulk and best efforts each dipped 100 bps.
  • Investor count steady: The average number of active investors held at 11, reflecting stable liquidity conditions. Historical counts ranged from 8 in November 2024 to 12 in December 2024.
  • Higher-tier pricing dominates: With 81% of loans sold at the highest pricing tier, lenders demonstrated disciplined execution strategies that offset margin pressure from rate compression.

PRODUCT MIX AND BORROWER PROFILES

  • DTIs and affordability flat: Debt-to-income ratios and first-time homebuyer share held steady, signaling sideways affordability movement.
  • Balanced composition: FHA and conforming production growth offset earlier VA surge, keeping overall mix diverse across loan types.
  • Credit profiles, loan amounts dip: The average credit score fell to 734 from 735 MoM. The average loan amount decreased to $397,438 from $403,746. October loan averages ranged from $602,646 in metro New York to $312,177 in Indianapolis. Average loan-to-value (LTV) ratios ranged from 70% in San Francisco to 87% in San Antonio.

To view the full October 2025 Market Advantage report, complete the free subscription form: https://engage.optimalblue.com/market-advantage. Subscribers receive a report PDF each month with the latest data. Members of the press are eligible for special, advance access each month and should contact Olivia DeLancey to be added to the media list.

Access this month’s podcast episode: https://market-advantage.captivate.fm/episode/episode-14.

ABOUT THE MARKET ADVANTAGE REPORT

Optimal Blue issues the Market Advantage mortgage report each month to provide insight into U.S. mortgage trends and drivers of lending profitability. Data is sourced from the Optimal Blue PPE, which is used to price and lock more than one-third of all mortgages nationwide, and Optimal Blue’s hedging and loan trading system, which supports approximately 40% of loans hedged and sold into the secondary market. As the leader in mortgage capital markets technology, Optimal Blue has a direct view of both origination and secondary market activity and the interconnectedness of the two. Unlike self-reported survey data, Optimal Blue’s direct-source data accurately reflect the in-process loans in lenders’ pipelines and secondary market executions. Visit Optimal Blue’s website to subscribe to receive the free report each month.

Nothing herein shall be construed as, nor is Optimal Blue providing, any legal, trading, hedging or financial advice.

ABOUT OPTIMAL BLUE

Optimal Blue powers profitability across the mortgage capital markets ecosystem. As the industry’s only end-to-end capital markets platform, our technology, data, and integrations bridge the primary and secondary markets to help lenders of all sizes maximize performance – from pricing transparency and accuracy to pipeline risk management and every step in between. Backed by over 20 years of proven expertise, our modern, cloud-native technology delivers the real-time automation, actionable data, and seamless connectivity lenders need to navigate market volatility and scale for growth. To learn more about how Optimal Blue delivers measurable ROI, visit https://OptimalBlue.com/.

MULTIMEDIA

Image link for media: https://www.Send2Press.com/300dpi/25-1111-s2p-opblueoct-300dpi.webp

Image caption: Optimal Blue’s October 2025 Market Advantage mortgage data report.

NEWS SOURCE: Optimal Blue


This press release was issued on behalf of the news source (Optimal Blue), who is solely responsible for its accuracy, by Send2Press Newswire. Image, if any, was provided by the news source and not this website or the wire service. Information is believed accurate, as provided by the news source, but is not guaranteed.

To view the original story, visit: https://www.send2press.com/wire/optimal-blue-report-october-lock-volume-holds-second-highest-level-in-three-years/

Copr. © 2025 Send2Press® Newswire, Calif., USA. -- REF: S2P STORY ID: S2P130911 NOREL-3B


Optimal Blue report: Rate rally drives 28% surge in September lock volumes

Affordability gains fuel with biggest refi wave since early 2022, MSR values dip and securitization trends point to rising large-lender market share

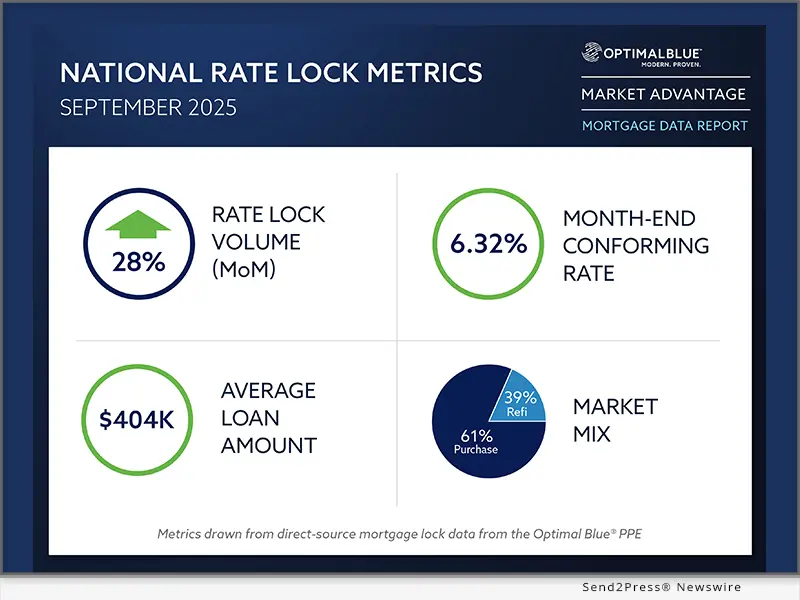
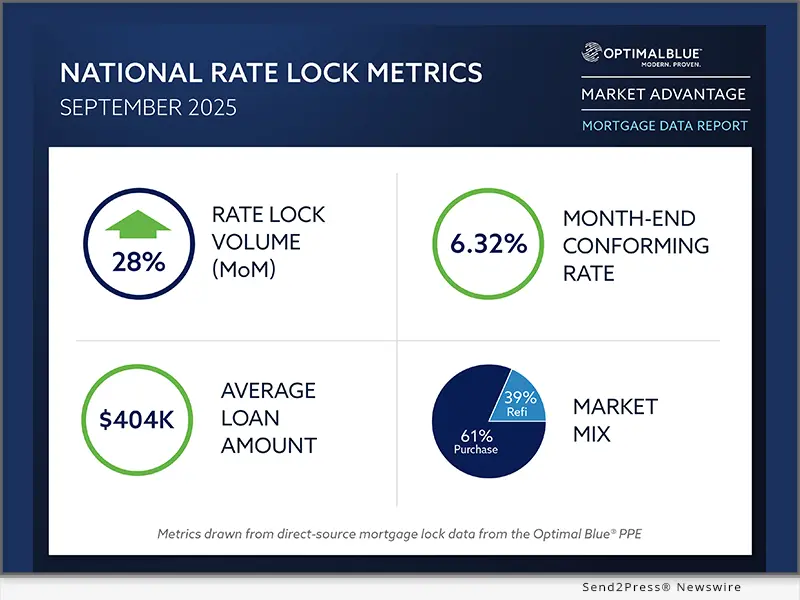
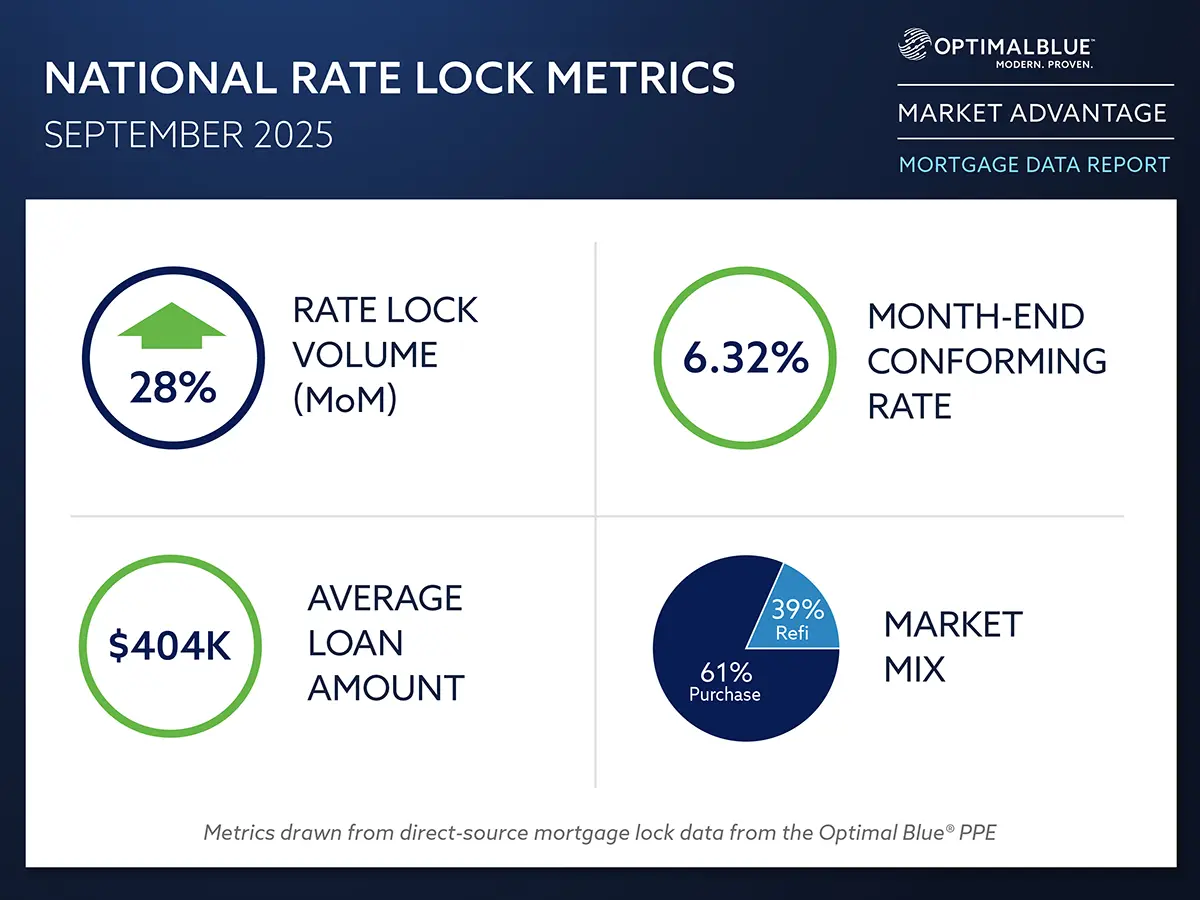
PLANO, Texas, Oct. 14, 2025 (SEND2PRESS NEWSWIRE) — Optimal Blue today released its September 2025 Market Advantage mortgage data report, which showed a sharp increase in rate-lock activity as mortgage rates fell throughout the month to their lowest levels in nearly a year. Total lock volume rose 28% month over month (MoM), led by a surge in refinance lending as borrowers seized on the opportunity to lower monthly payments. Purchases also climbed 6% MoM, outperforming typical seasonal trends as improved affordability brought more buyers into the market.

Optimal Blue's September 2025 Market Advantage mortgage data report
Image caption: Image caption: Optimal Blue’s September 2025 Market Advantage mortgage data report.

“The rate rally that began in late summer accelerated in September, and borrowers reacted quickly,” said Mike Vough, head of corporate strategy at Optimal Blue. “Rate-and-term refinance locks jumped 153% month over month, lifting total refi share to 39% – the highest level we’ve seen in more than two years. That momentum also spilled into purchase lending as affordability improved, particularly for first-time homebuyers.”

The Optimal Blue Mortgage Market Indices (OBMMI) 30-year conforming fixed rate, the benchmark for CME Group’s Mortgage Rate futures, ended September at 6.32%, down 18 basis points (bps) from August. Jumbo rates dropped 11 bps to 6.47%, FHA fell 18 bps to 6.08% and VA declined 18 bps to 5.82%, reinforcing the broader affordability shift seen across loan types.

The report also highlighted notable movements in capital markets execution. Sales to the agency cash window and aggregators each fell 100 bps to 23% and 32% respectively, while agency mortgage-backed security (MBS) executions increased to 42% from 40%, reflecting stronger securitization activity among large lenders. The share of loans sold at the highest pricing tier climbed to 78%, up 300 bps, suggesting less focus on delivery profiles and fewer eligibility exceptions influenced pricing decisions.

“This combination of stronger pricing and greater securitization participation underscores lenders’ efforts to optimize execution as volume rebounds while maintaining profitability,” Vough said. “Even as MSR values edged down 6 bps in September, nearly eight in ten loans were sold at the highest pricing tier, showing how lenders are offsetting that compression through broader investor engagement.”

Key findings from the Market Advantage report, derived from direct-source mortgage lock and secondary market data, include:

Volume trends and market composition

  • Lock activity jumps: Total rate-lock volume increased 28% in September as falling rates reignited borrower demand.
  • Purchase volume rises: Purchase locks climbed 6% MoM and 9% year over year (YoY), outperforming typical late-season expectations.
  • Refinances dominate growth: Refi share expanded to 39% of all locks – the highest since early 2022 – driven by a 153% MoM increase in rate-and-term refinances and a 13% gain in cash-outs.
  • Refi pull-through improves: The pull-through rate for purchases climbed 58 bps to 83.6%. Refinance pull-through rose 82 bps to 60.2%.

Rates and pricing

  • Rates retreat across loan types: The OBMMI 30-year conforming fixed rate fell 18 bps to 6.32%. Jumbo rates dropped 11 bps to 6.47%, FHA loan rates fell 18 bps to 6.08% and VA loan rates declined 18 bps to 5.82%.
  • MSR valuations ease: Servicing values for conforming 30-year loans slipped 6 bps to 1.09% (a 4.36 multiple), mirroring rate declines and an average 30 bps drop in OBMMI levels across the month.
  • Lenders capture stronger execution: The share of loans sold at the highest pricing tier climbed to 78%, up 300 bps from August, signaling decreased focus on lender profile and eligibility and stronger focus on improved profitability.

Channel and execution

  • Securitization strengthens: Agency MBS executions increased to 42% from 40%, while deliveries to the agency cash window and aggregators fell 100 bps each to 23% and 32%, respectively.
  • Investor engagement steady: The average number of active investors held at 11, consistent with recent months as secondary market liquidity remained stable.

Product mix and borrower profiles

  • Conforming and VA gain share: Conforming and VA each picked up just over 1 percentage point of market share as borrowers in those segments moved quickly to refinance.
  • Credit profiles strengthen in refis: Average credit scores rose to 746 (up 9 points) for rate-and-term refinances and to 701 (up 7 points) for cash-outs as higher-credit borrowers responded first to lower rates.
  • DTI trends lower: Debt-to-income ratios declined for both conforming and FHA production and were down across all products YoY, signaling improving affordability.
  • FTHB participation increases: First-time homebuyer share rose in both FHA and VA production – up 1 bp each – while conforming was unchanged.
  • Loan amounts edge higher: The average loan amount was $403,746, up from $386,387 in August and $382,476 in July. September averages ranged from $605,542 in metro New York to $305,829 in Indianapolis. Average LTVs ranged from 73.57 in New York to 82.22 in Indianapolis.

To view the full September 2025 Market Advantage report, subscribe for free: https://engage.optimalblue.com/market-advantage. Subscribers receive a report PDF each month with the latest data. Members of the press are eligible for special, advance access each month and should contact Olivia DeLancey to be added to the media list.

This month’s Market Advantage podcast features Andria Lightfoot, vice president of client success at FirstClose. Access the podcast: https://market-advantage.captivate.fm/episode/episode-13.

About the Market Advantage Report

Optimal Blue issues the Market Advantage mortgage report each month to provide transparency and insight into U.S. mortgage trends and drivers of lending profitability. Data is sourced from the Optimal Blue PPE, which is used to price and lock more than one-third of all mortgages nationwide, and Optimal Blue’s hedging and loan trading system, which supports approximately 40% of loans hedged and sold into the secondary market. As the leader in mortgage capital markets technology, Optimal Blue has a direct view of both origination and secondary market activity and the interconnectedness of the two. Unlike self-reported survey data, Optimal Blue’s direct-source data accurately reflect the in-process loans in lenders’ pipelines and secondary market executions. Visit Optimal Blue’s website to subscribe to receive the free report each month.

Nothing herein shall be construed as, nor is Optimal Blue providing, any legal, trading, hedging, or financial advice.

About Optimal Blue

Optimal Blue powers profitability across the mortgage capital markets ecosystem. As the industry’s only end-to-end capital markets platform, our technology, data and integrations bridge the primary and secondary markets to help lenders of all sizes maximize performance – from pricing transparency and accuracy to margin protection and every step in between. Backed by over 20 years of proven expertise, our modern, cloud-native technology delivers the real-time automation, actionable data and seamless connectivity lenders need to navigate market volatility and scale for growth. To learn more about how Optimal Blue delivers measurable ROI, visit OptimalBlue.com.

MUILTIMEDIA:

Image link for media: https://www.Send2Press.com/300dpi/25-1014-s2p-optbluesep25-300dpi.webp

Image caption: Optimal Blue’s September 2025 Market Advantage mortgage data report.

NEWS SOURCE: Optimal Blue


This press release was issued on behalf of the news source (Optimal Blue), who is solely responsible for its accuracy, by Send2Press Newswire. Image, if any, was provided by the news source and not this website or the wire service. Information is believed accurate, as provided by the news source, but is not guaranteed.

To view the original story, visit: https://www.send2press.com/wire/optimal-blue-report-rate-rally-drives-28-surge-in-september-lock-volumes/

Copr. © 2025 Send2Press® Newswire, Calif., USA. -- REF: S2P STORY ID: S2P130114 NOREL-3B


Refinances surge nearly 70% as purchase activity falls 10% in August

Seasonal slowdown weighs on purchases; lenders lean on securitization and non-QM to drive performance

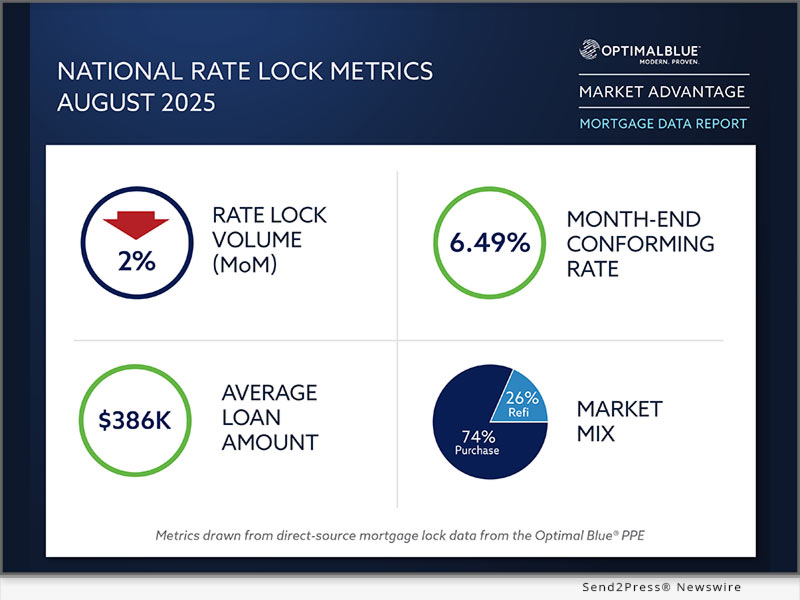
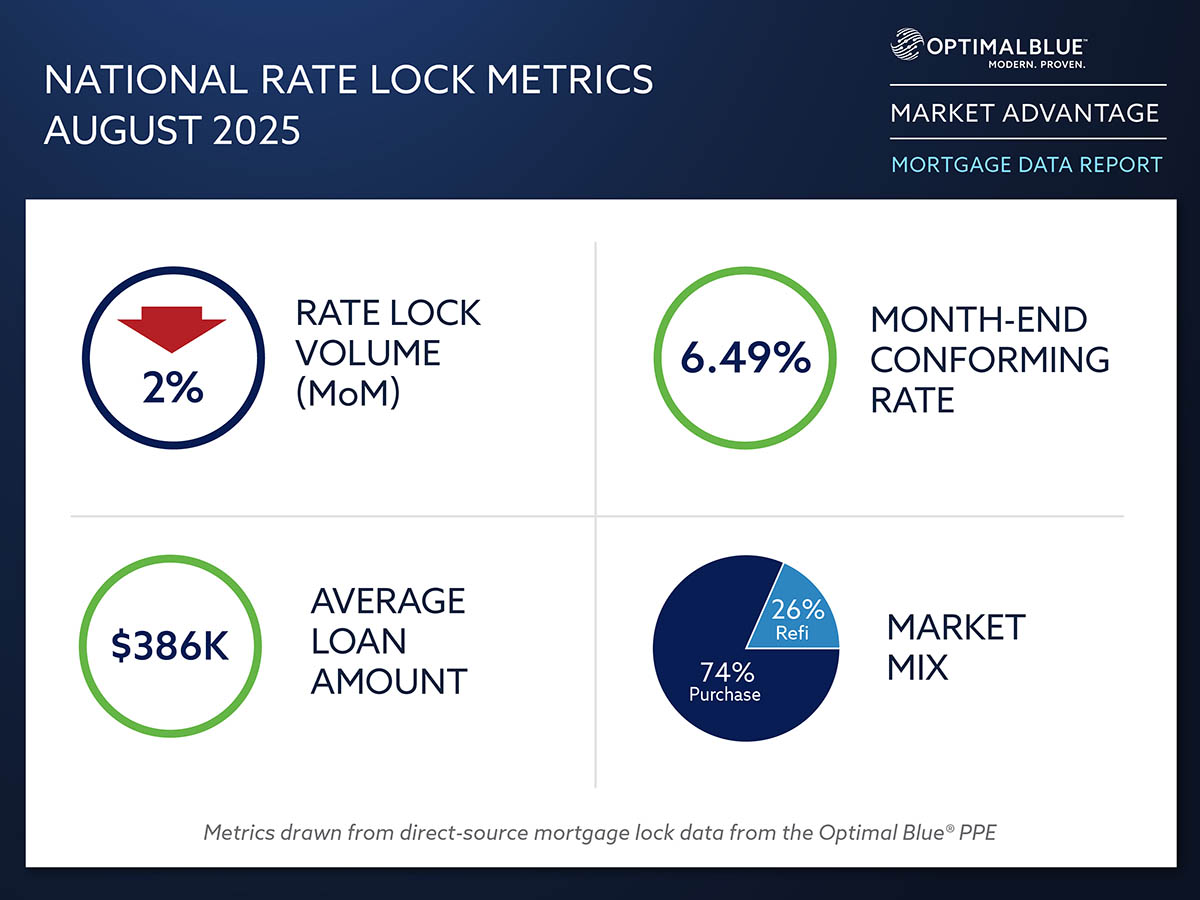
PLANO, Texas, Sept. 10, 2025 (SEND2PRESS NEWSWIRE) — Optimal Blue today released its August 2025 Market Advantage mortgage data report, which found a sharp split between purchase and refinance trends as seasonal factors and falling rates reshaped origination activity. Total lock volume dipped about 2% month over month (MoM) as a roughly 10% drop in purchase locks outweighed the strongest month for rate-and-term refinances this year, which surged nearly 70%. Non-QM lending also reached a new milestone in August, climbing to a record 8.3% of originations – up from 5.6% a year earlier and just 1.4% in August 2020 – extending the steady growth trend first highlighted in last month’s report.

Optimal Blue's August 2025 Market Advantage mortgage data report
Image caption: Optimal Blue’s August 2025 Market Advantage mortgage data report.

“Borrowers are responding quickly to rate improvements, driving the strongest month for rate-and-term refinances we’ve seen this year,” said Mike Vough, head of corporate strategy at Optimal Blue. “At the same time, purchase activity is beginning its typical seasonal decline, while product mix is shifting with non-QM lending at record levels.”

The OBMMI 30-year conforming fixed rate, the benchmark for CME Group’s Mortgage Rate futures, ended August at 6.49%, down nearly a quarter point from July. Jumbo, FHA and VA rates also declined, falling 32, 24 and 33 basis points (bps), respectively.

The report also pointed to significant changes in capital markets execution, with securitization playing a larger role in loan sales. Agency cash window deliveries fell to 24% while agency MBS executions climbed to 40%, highlighting stronger securitization activity among larger lenders.

“This trend underscores how lenders are strategically adapting to optimize execution in order to gain market share,” Vough said. “We’re seeing deeper engagement in securitization alongside more loans sold to the highest price during loan sales, signaling that capital markets strategies are adjusting to increase profitability.”

Key findings from the Market Advantage report, derived from direct-source mortgage lock and secondary market data, include:

Volume trends and market composition

  • Lock volumes dip: Overall activity slowed 1.8% in August as the seasonal decline in purchase demand outpaced gains in refinance activity.
  • Purchase volumes slip: Purchase volume fell 9.8% MoM but remained flat year over year (YoY), ushering in the typical post–peak season slowdown.
  • Refis surge: Refinances rose to 26% of originations, up sharply MoM and YoY, as rate-and-term refinances surged 69.8% while cash-outs gained 2.2%.

Rates and pricing

  • Benchmark rates drop: The OBMMI ended August at 6.49%, down nearly a quarter point from July. Jumbo rates fell 32 bps to 6.57%, FHA decreased 24 bps to 6.26% and VA declined 33 bps to 6.00%, creating opportunities across loan types.
  • Pricing strength improves: Loans sold at the highest pricing tier rose to 75%, a 5-point increase, suggesting lenders delivered cleaner loan profiles and captured stronger pricing.
  • MSR valuations soften: MSR values dipped to 1.15% for conforming 30-year loans, down 4 bps, in line with lower rates that compressed servicing valuations.

Channel and execution

  • Cash share declines: Agency cash window sales fell 200 bps to 24% as lenders leaned less on cash executions in favor of strategic delivery methods.
  • MBS executions rise: Agency MBS executions climbed to 40%, reflecting increased securitization by larger lenders optimizing capital markets execution and market share.
  • Pull-through rates mixed: Purchase pull-through rose 22 bps to 84.2%, while refinance pull-through slipped 15 bps to 61%, indicating some softening in refi pipeline performance.

Product mix and borrower profiles

  • Non-QM hits record: Non-QM share rose to 8.34% of all originations in August, up from 8.03% in July and setting a new record high.
  • Conforming declines: Conforming share fell 123 bps to 51%. VA loans gained 78 bps to 12.1%, non-conforming increased 48 bps to 17.3%, FHA edged up 1 bp to 19% and USDA dipped 5 bps to 0.7%.
  • New build activity softens: Planned unit development (PUD) lending fell below 28% of production, down more than 4.5% YoY as new construction market share continued to contract.
  • FTHB activity steady: First-time homebuyer share held flat for conforming and FHA loans and dipped slightly for VA.
  • Borrower profiles remain strong: The average conforming FICO Score was 756, unchanged MoM. Average loan amounts rose to $386,387 from $382,476 in July, ranging from $600,110 in metro New York to $304,511 in Indianapolis. Average LTVs ranged from 73.56 in New York to 81.61 in Indianapolis.
  • ARMs hold: Adjustable-rate mortgages accounted for 10.25% of overall lock activity.

To view the full August 2025 Market Advantage report, complete the free subscription form: https://engage.optimalblue.com/market-advantage. Subscribers receive a report PDF each month with the latest data. Members of the press are eligible for special, advance access each month and should contact Olivia DeLancey to be added to the media list.

This month’s Market Advantage podcast features Optimal Blue Chief Technology Officer Seever Sulaiman. Access the podcast: https://market-advantage.captivate.fm/episode/episode-12 .

About the Market Advantage Report

Optimal Blue issues the Market Advantage mortgage report each month to provide insight into U.S. mortgage trends and drivers of lending profitability. Data is sourced from the Optimal Blue PPE, which is used to price and lock more than one-third of all mortgages nationwide, and Optimal Blue’s hedging and loan trading system, which supports approximately 40% of loans hedged and sold into the secondary market. As the leader in mortgage capital markets technology, Optimal Blue has a direct view of both origination and secondary market activity, and the interconnectedness of the two. Unlike self-reported survey data, Optimal Blue’s direct-source data accurately reflect the in-process loans in lenders’ pipelines and secondary market executions. Visit Optimal Blue’s website to subscribe to receive the free report each month.

Nothing herein shall be construed as, nor is Optimal Blue providing, any legal, trading, hedging, or financial advice.

About Optimal Blue

Optimal Blue powers profitability across the mortgage capital markets ecosystem. As the industry’s only end-to-end capital markets platform, our technology, data and integrations bridge the primary and secondary markets to help lenders of all sizes maximize performance – from pricing accuracy to margin protection and every step in between. Backed by over 20 years of proven expertise, our modern, cloud-native technology delivers the real-time automation, actionable data and seamless connectivity lenders need to navigate market volatility and scale for growth. To learn more about how Optimal Blue delivers measurable ROI, visit OptimalBlue.com.

MULTIMEDIAL

Image link for media: https://www.Send2Press.com/300dpi/25-0910-s2p-opbluaug25-300dpi.jpg

Image caption: Optimal Blue’s August 2025 Market Advantage mortgage data report

NEWS SOURCE: Optimal Blue


This press release was issued on behalf of the news source (Optimal Blue), who is solely responsible for its accuracy, by Send2Press Newswire. Image, if any, was provided by the news source and not this website or the wire service. Information is believed accurate, as provided by the news source, but is not guaranteed.

To view the original story, visit: https://www.send2press.com/wire/refinances-surge-nearly-70-as-purchase-activity-falls-10-in-august/

Copr. © 2025 Send2Press® Newswire, Calif., USA. -- REF: S2P STORY ID: S2P129198 NOREL-3B
 

Refinances tick up and non-QM hits record high as purchase activity falls nearly 5% in July

Lenders respond to affordability pressures with loan product diversity and pricing strategies

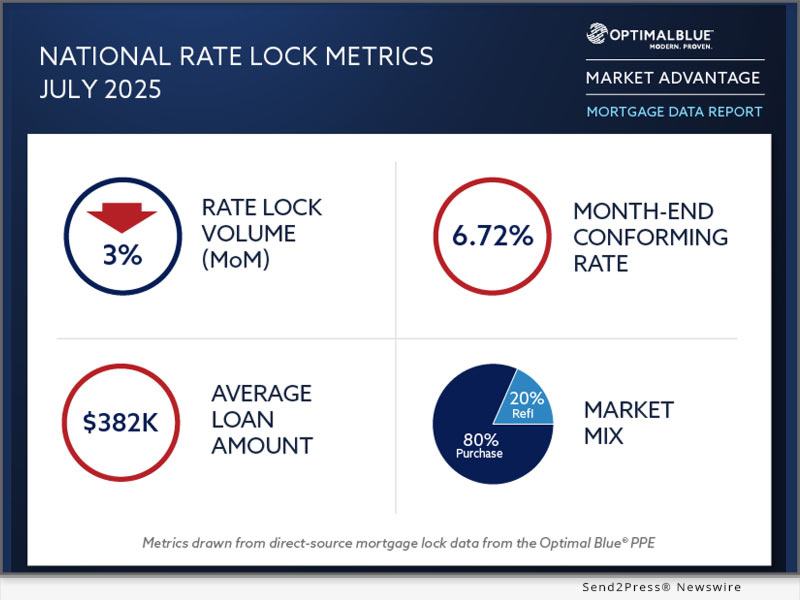
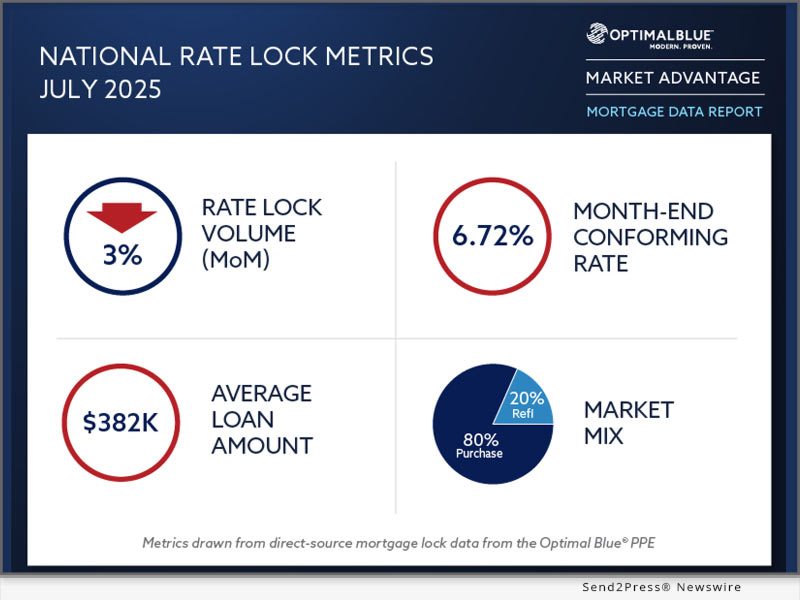
PLANO, Texas, Aug. 12, 2025 (SEND2PRESS NEWSWIRE) — Optimal Blue today released its July 2025 Market Advantage mortgage data report, which found a 3% month-over-month (MoM) drop in overall rate lock volume, led by a nearly 5% drop in purchase activity as affordability remained strained.

Optimal Blue’s July 2025 Market Advantage mortgage data report
Image caption: Optimal Blue’s July 2025 Market Advantage mortgage data report.

Mortgage rates rose MoM across all loan types. The OBMMI 30-year conforming fixed rate, the benchmark for CME Group’s Mortgage Rate futures, ended July at 6.72%, up 5 basis points (bps). FHA, VA and jumbo rates also ticked up, rising 3, 4 and 11 bps respectively to 6.50%, 6.33% and 6.89%.

While purchase volume held steady year-over-year (YoY), refinancing showed renewed strength in July. Cash-out and rate-and-term refinance locks rose 5% and 7% respectively, partially offsetting the broader softness in the purchase market.

“As we near the end of peak buying season, 2025 purchase activity has largely tracked with 2024,” said Mike Vough, head of corporate strategy at Optimal Blue. “With affordability still a major constraint, purchase volume in line with 2024 is generally a disappointment to the industry based on 2025 projections We’re seeing more cash-out (+27% annually) and rate-and-term (+13% annually) opportunities as borrowers with post-2022 loans respond to even modest rate improvements, and borrowers may be undergoing some financial stress based on cash-out increases.”

Non-QM lending reached a new milestone in July, accounting for 8% of total rate lock volume – the highest on record. At the same time, GSE-eligible originations fell to 52.2% and non-conforming lending rose to 16.8%, underscoring a market shift toward nontraditional financing solutions. This can be attributed to elevated rates, increased debt, growing openness to alternative forms of income verification, and conventional loan limits, which are prompting more borrowers to seek flexible qualification paths.

“There’s growing separation in the ways larger and smaller lenders are managing profitability,” Vough added. “We saw an uptick in agency MBS executions, insinuating more market share is going to depositories and large IMBs, alongside stronger bid-to-cover ratios, indicating lenders are chasing the highest price over other execution considerations. Combined with deeper engagement in OBMMI-tied CME futures and many conversations about capital markets strategies for non-agency loans, it’s clear lenders are being proactive in their pricing, margin and pipeline risk strategies.”

Key findings from the Market Advantage report, derived from direct-source mortgage lock and secondary market data, include:

Volume trends and market composition

  • Volume down: Total locks declined 3% MoM in July, driven primarily by a 5% drop in purchase activity and reflecting ongoing affordability challenges.
  • Refinance share increases: Although only 20% of the market, refis are gaining traction as borrowers with post-2022 loans find opportunities to lower monthly payments. Cash-out and rate-and-term refis rose 5% and 7%, respectively.
  • PUD volume rises: Planned unit development (PUD) activity grew 0.85% to 28.5% of all production, while single-family homes declined by 0.87% to 63.5%. Despite the monthly increase, new construction market share is down 4% YoY, pointing to a broader builder pullback.

Rates and pricing

  • Benchmark rates climb: The OBMMI ended July at 6.72%, up 5 bps after dipping to ~6.625% earlier in the month. FHA rose 3 bps to 6.50%, VA increased 4 bps to 6.33% and jumbo jumped 11 bps to 6.89%.
  • MSRs dip: Mortgage servicing rights (MSRs) for conforming 30-year loans fell 3 bps to 1.19, moving in counter to OBMMI, but impacted by increases in intramonth volatility.
  • Futures activity rises: CME futures tied to the OBMMI are attracting increased interest from MSR holders and pipeline hedgers seeking to manage rate risk. MSR values tend to fluctuate with interest rate expectations, and recent activity suggests growing demand for tools that help mitigate exposure.

Channel and execution

  • Conventional share slips: The GSE-eligible share declined 0.78% to 52.2%, while non-conforming originations (including jumbo and non-QM) rose 0.62% to 16.8%. FHA, VA and USDA volumes remained flat MoM.
  • Hedged loan sales shift: Sales to the agency cash window fell 200 bps to 26%, while agency mortgage-backed security (MBS) executions rose to 37%, reflecting stronger securitization activity among large lenders and potential for market share increase from this cohort.
  • Loan sales favor higher pricing tiers: The share of loans sold at the highest price rose to 70% (+100 bps), while loans sold in the fourth tier or worse fell to 11% (-100 bps), suggesting that eligibility exceptions and representative delivery profiles played a smaller role in pricing decisions than in prior months.

Product mix and borrower profiles

  • Non-QM reaches record: The share of non-QM loans hit 8% of total volume for the first time, with investor/DSCR at 29%, bank statement loans at 34% and other non-traditional income documentation methods at 38%.
  • ARMs gain: Adjustable-rate mortgages (ARMs) rose to 9.52% of overall volume in July, up from 8.81% in June, despite the SOFR curve flattening with the 2-year/10-year spread dropping ~ 7 bps, but remaining positively sloped.
  • Average credit scores: Conforming FICO scores fell 1 point to 756, and FHA scores dropped to 675, while VA remained flat at 713.
  • Loan amounts dip: The average loan amount was $382,476, down from $386,084 in June. Of the top 30 MSAs, average loan amounts ranged from a high of $609,008 in the New York region to a low of $476,637 in Sacramento, California.

To view the full July 2025 Market Advantage report, complete the free subscription form: https://engage.optimalblue.com/market-advantage. Subscribers receive a report PDF each month with the latest data. Members of the press are eligible for special, advance access each month and should contact Olivia DeLancey to be added to the media list.

This month’s Market Advantage podcast features Julian Hebron, founder of The Basis Point. Access the podcast: https://market-advantage.captivate.fm/episode/episode-11.

About the Market Advantage Report

Optimal Blue issues the Market Advantage mortgage report each month to provide insight into U.S. mortgage trends and drivers of lending profitability. Data is sourced from the Optimal Blue PPE, which is used to price and lock more than one-third of all mortgages nationwide, and Optimal Blue’s hedging and loan trading system, which supports approximately 40% of loans hedged and sold into the secondary market. As the leader in mortgage capital markets technology, Optimal Blue has a direct view of both origination and secondary market activity, and the interconnectedness of the two. Unlike self-reported survey data, Optimal Blue’s direct-source data accurately reflect the in-process loans in lenders’ pipelines and secondary market executions. Visit Optimal Blue’s website to subscribe to receive the free report each month.

Nothing herein shall be construed as, nor is Optimal Blue providing, any legal, trading, hedging, or financial advice.

About Optimal Blue

Optimal Blue powers profitability across the mortgage capital markets ecosystem. As the industry’s only end-to-end capital markets platform, our technology, data, and integrations bridge the primary and secondary markets to help lenders of all sizes maximize performance – from pricing accuracy to margin protection and every step in between. Backed by over 20 years of proven expertise, our modern, cloud-native technology delivers the real-time automation, actionable data, and seamless connectivity lenders need to navigate market volatility and scale for growth. To learn more about how Optimal Blue delivers measurable ROI, visit OptimalBlue.com.

MULTIMEDIA:

Image link for media https://www.Send2Press.com/300dpi/25-0812-s2p-opblue-july-300dpi.jpg

Image caption: Optimal Blue’s July 2025 Market Advantage mortgage data report.

NEWS SOURCE: Optimal Blue


This press release was issued on behalf of the news source (Optimal Blue), who is solely responsible for its accuracy, by Send2Press Newswire. Image, if any, was provided by the news source and not this website or the wire service. Information is believed accurate, as provided by the news source, but is not guaranteed.

To view the original story, visit: https://www.send2press.com/wire/refinances-tick-up-and-non-qm-hits-record-high-as-purchase-activity-falls-nearly-5-in-july/

Copr. © 2025 Send2Press® Newswire, Calif., USA. -- REF: S2P STORY ID: S2P128390 NOREL-3B
 

Optimal Blue Releases May Data Findings, Announces Expansion of Monthly Report for More Comprehensive Lender Profitability Insights

Company adds nine new data metrics to its Market Advantage mortgage data report for deeper view into drivers of lending profitability, including DTI, loan sale execution and borrower profiles

PLANO, Texas, June 10, 2025 (SEND2PRESS NEWSWIRE) — Optimal Blue today released the May 2025 edition of its now-expanded Market Advantage mortgage data report, which features newly added borrower profile and capital market datasets for a more comprehensive picture of early-stage mortgage activity and loan profitability. The enhancements come at a critical time for mortgage lenders navigating heightened interest rates, tighter margins, increased volatility and deepening affordability challenges.

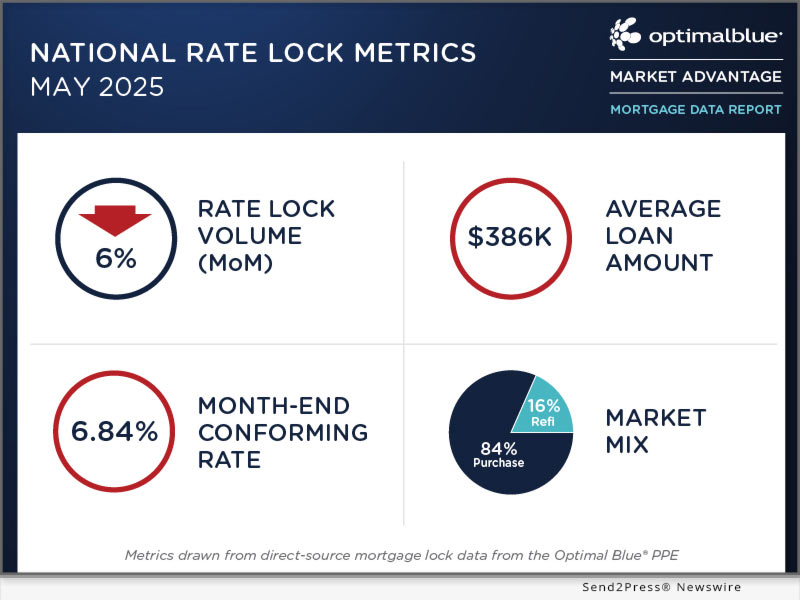
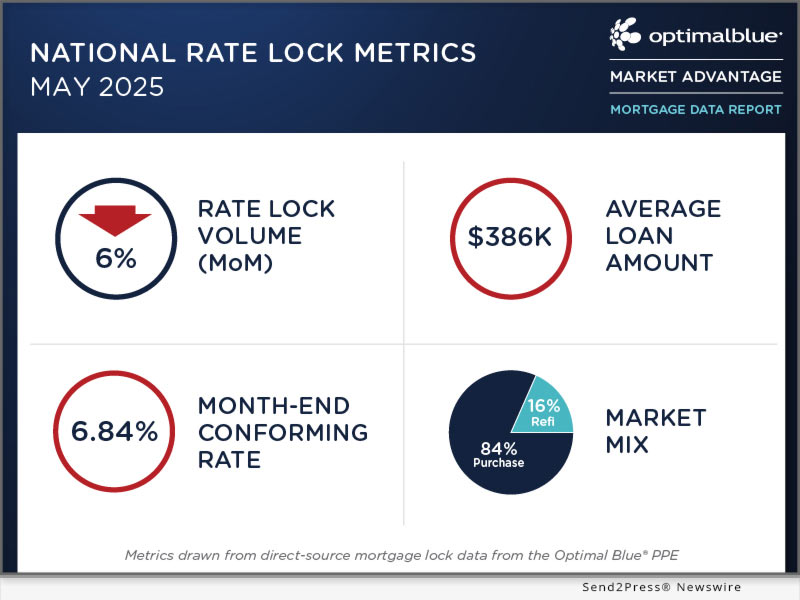
Optimal Blue's May 2025 Market Advantage mortgage data report
Image caption: Optimal Blue’s May 2025 Market Advantage mortgage data report.

NEW DATA REVEALS DEEPER INSIGHTS INTO BORROWER BEHAVIOR AND CAPITAL MARKETS DYNAMICS

This month’s report includes five new borrower profile metrics, including first-time homebuyer status, debt-to-income ratio and citizenship, as well as four new secondary market indicators, including data on loan sale execution and servicing valuations. These insights help lenders understand not just who is borrowing, but how loan performance and profitability are being shaped in capital markets.

“The Market Advantage has long been a trusted source for early mortgage market insights, and we’ve used Optimal Blue’s position as the leader in capital markets technology to take the report to the next level,” said Mike Vough, head of corporate strategy at Optimal Blue. “These new metrics provide deeper insight into the interconnectedness of front-end borrower affordability and back-end loan sale execution, allowing housing finance professionals and market observers alike to better understand how primary market activity and secondary market dynamics intersect to drive lending profitability.”

SPRING HOMEBUYING SEASON UNDERPERFORMS AS AFFORDABILITY TIGHTENS

While May typically brings a seasonal lift in purchase activity, this year’s data tells a different story. Total lock volume fell 5.87% month-over-month (MoM), and purchase activity was flat – a clear underperformance for what is typically one of the strongest homebuying months of the year. Rising interest rates further suppressed refinance incentives, dragging refinance share down from 21% to 16%.

“Rising mortgage rates are squeezing borrower affordability, while tighter spreads are putting pressure on lenders in the secondary market,” said Brennan O’Connell, director of data solutions at Optimal Blue. “With the brief window of affordability relief now closed, the new data shows first-time buyers are feeling the strain, with modest declines in their share of conforming and FHA loan locks.”

Key findings from the Market Advantage report, derived from direct-source mortgage lock and secondary market data, include:

  • Overall lock activity declines: Total mortgage rate lock volume fell 5.87% MoM, reflecting a more difficult rate environment.
  • Refinance activity drops sharply: Refinance share declined from 21% to 16% as rising rates further eroded borrower incentive. Rate-and-term refinances were down 44.4% MoM, while cash-out refis fell 10%.
  • Spring purchase demand underwhelms: Purchase activity was flat MoM, and purchase lock counts (which control for home price appreciation) were down 10% year-over-year (YoY).
  • Rates rise and spreads tighten: The OBMMI 30-year conforming fixed rate (the benchmark for the CME Mortgage Rate futures) rose 16 basis points to 6.84%. The 10-year Treasury yield increased 26 bps to 4.41%, narrowing the OBMMI-Treasury spread to 2.44%, a 10 bps MoM contraction. This signal of rising secondary market pressure was reinforced by slight declines in two of the newly added metrics in this month’s report: servicing valuations and the share of loans executed at the highest price.
  • Product mix shifts modestly: Conforming loan share rose to 51.9% (up 92 bps), and nonconforming share edged up to 16.4% (up 4 bps). Government-backed lending declined as FHA share fell to 19.7% (down 52 bps), VA dropped to 11.4% (down 48 bps) and USDA lending held steady at 0.7%.
  • Credit quality holds steady: The average FICO score and average debt-to-income (DTI) ratio held steady across various loan programs.
  • Loan amounts trend lower: The average loan amount dipped slightly to $386,460 from April’s $387,523. Average loan-to-value (LTV) ratio stood at 80.87%. Across the top 30 metropolitan statistical areas, average loan amounts ranged from a high of $602,888 in metro New York to a low of $385,597 in Raleigh, North Carolina.
  • ARM usage declines: Adjustable-rate mortgages accounted for 9.11% of lock volume, down from 10.3% in April.
  • FTHB share softens: First-time homebuyer share was 42% for conforming loans (down 1%), 68% for FHA (down 2%) and 48% for VA (up 1%). The decline in conforming and FHA FTHB share suggests affordability headwinds may be weighing more heavily on entry-level borrowers.
  • Non-QM lending edges up: Loans locked under expanded guidelines (i.e., non-QM) represented 7.36% of May’s volume, continuing a gradual upward trend as lenders and borrowers explore alternative qualification paths.

To view the full May 2025 Market Advantage report, complete the free subscription form: https://engage.optimalblue.com/market-advantage. Subscribers receive a report PDF each month with the latest data. Members of the press are eligible for special, advance access each month and should contact Olivia DeLancey to be added to the media list.

This month’s Market Advantage podcast features Optimal Blue CEO Joe Tyrrell. Access the podcast: https://market-advantage.captivate.fm/episode/episode-9/

ABOUT THE MARKET ADVANTAGE REPORT

Optimal Blue issues the Market Advantage mortgage data report each month to provide insight into U.S. mortgage trends and drivers of lending profitability. Data is sourced from the Optimal Blue PPE, which is used to price and lock more than one-third of all mortgages nationwide, and Optimal Blue’s hedging and loan trading system, which supports approximately 40% of loans hedged and sold into the secondary market. As the leader in mortgage capital markets technology, Optimal Blue has a direct view of both origination and secondary market activity, and the interconnectedness of the two. Unlike self-reported survey data, Optimal Blue’s direct-source data accurately reflect the in-process loans in lenders’ pipelines and secondary market executions. Visit Optimal Blue’s website to subscribe to receive the free report each month.

Nothing herein shall be construed as, nor is Optimal Blue providing, any legal, trading, hedging, or financial advice.

About Optimal Blue

Optimal Blue effectively bridges the primary and secondary mortgage markets to deliver the industry’s only end-to-end capital markets platform. The company helps lenders of all sizes and scopes maximize profitability and operate efficiently so they can help American borrowers achieve the dream of homeownership. Through innovative technology, a network of interconnectivity, rich data insights, and expertise gathered over more than 20 years, Optimal Blue is an experienced partner that, in any market environment, allows lenders to optimize their advantage from pricing accuracy to margin protection, and every step in between. To learn more, visit https://OptimalBlue.com/.

IMAGE LINK for media: https://www.Send2Press.com/300dpi/25-0619-s2p-opbluemay25-300dpi.jpg

Image caption: Optimal Blue’s May 2025 Market Advantage mortgage data report

NEWS SOURCE: Optimal Blue


This press release was issued on behalf of the news source (Optimal Blue), who is solely responsible for its accuracy, by Send2Press Newswire. Image, if any, was provided by the news source and not this website or the wire service. Information is believed accurate, as provided by the news source, but is not guaranteed.

To view the original story, visit: https://www.send2press.com/wire/optimal-blue-releases-may-data-findings-announces-expansion-of-monthly-report-for-more-comprehensive-lender-profitability-insights/

Copr. © 2025 Send2Press® Newswire, Calif., USA. -- REF: S2P STORY ID: S2P126818 NOREL-3B
 

Lock Volume Rises 3.2% in April, Driven by Uptick in FHA Loans, Despite Economic Volatility

Optimal Blue's April 2025 Market Advantage data report shows stronger purchase activity, a shifting loan mix, and signs of investor caution

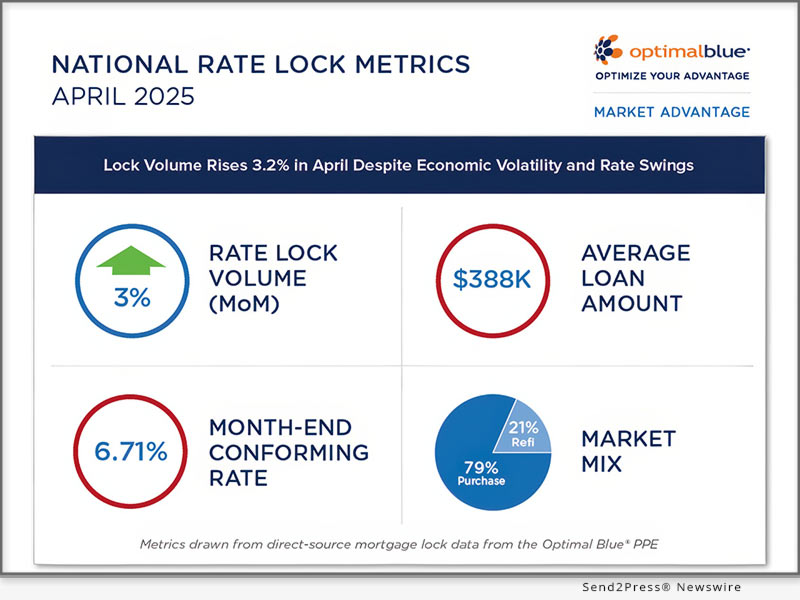
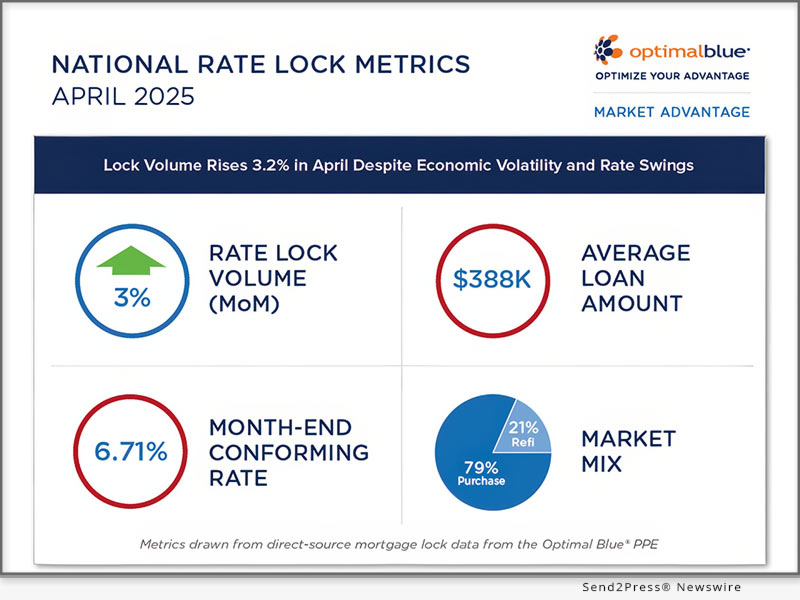
PLANO, Texas, May 13, 2025 (SEND2PRESS NEWSWIRE) — Optimal Blue today released its April 2025 Market Advantage mortgage data report showing total loan lock volume rose 3.2% month-over-month (MoM) as the spring homebuying season progressed, with purchase locks up 7.5% despite ongoing economic pressures.

Optimal Blue's April 2025 Market Advantage mortgage data report
Image caption: Optimal Blue’s April 2025 Market Advantage mortgage data report.

April kicked off with significant volatility in the bond market as investors responded to tariff announcements. Over the first 10 days of the month, interest rates fluctuated between 6.48% and 6.98%, a 50-basis-point (bps) range. The benchmark OBMMI 30-year conforming fixed rate briefly fell below 6.5% for the first time since October 2024 before climbing to end the month at 6.7%, about 10 bps above where it started.

“Last month’s report showed early signs of spring homebuyer activity, and April confirms the season is underway with a solid increase in purchase locks,” said Brennan O’Connell, director of data solutions at Optimal Blue. “We also saw a shift toward FHA loans, often used by first-time or credit-challenged buyers, and away from non-conforming products, possibly reflecting investor caution in response to broader economic uncertainty.”

Key findings from the Market Advantage report, derived from direct-source mortgage lock data, include:

  • Interest rate turbulence: Rates whipsawed at the start of the month amid market reactions to new tariff developments, dropping by one-eighth essentially overnight. The OBMMI 30-year conforming fixed rate – the benchmark for the CME Mortgage Rate futures contract – finished April at roughly 6.7%, up from 6.6% in March. FHA rates rose 17 bps to 6.44%, VA rates rose 9 bps to 6.28%, and jumbo rates climbed 11 bps to 6.84%.
  • YoY purchase volume down, again: While MoM purchase locks were up 7.5%, they were down 5% YoY. Isolating purchase loan counts reveals a deeper 7% YoY decline, continuing a trend seen each month so far this year.
  • FHA loans gain ground as other categories slip: FHA share rose to 20.2% in April, gaining 50 bps, while non-agency lending fell 46 bps to 16.4%. The shift suggests reduced investor risk tolerance amid economic uncertainty. Conforming loan share dipped slightly to 51%, and VA share also declined modestly to 11.8%. USDA volume remained steady at 0.6%.
  • Adjustable-rate mortgages rise: ARMs accounted for 10.34% of total lock volume in April, up from just under 9% in March, as buyers looked for ways to improve affordability.
  • Refinance activity stalls: After a couple of very strong days early in the month, refinance volume fell off in response to rising interest rates. Rate-and-term refis dropped 15% MoM, and cash-out refis dipped 3%. Refinance share fell from 25% in March to 21% in April.
  • Loan amounts, home prices edge down: The average loan amount declined to $387.5K from $391.7K, while the average purchase price slipped to $483.5K from $486.9K. Regional differences remain stark; average loan amounts ranged from $601,660 in the New York City metro area to $374,945 in greater Minneapolis.

The full Market Advantage report, which provides more detailed findings and additional insights into U.S. mortgage market trends, can be viewed at (PDF): https://www2.optimalblue.com/OB_MarketAdvantage_MortgageDataReport_Apr2025.pdf

This month’s Market Advantage podcast features Optimal Blue Chief Product Officer Erin Wester, discussing the impact of technological innovations in the mortgage industry. Watch or listen to the episode: https://market-advantage.captivate.fm/episode/episode-8/.

About the Market Advantage Report

Optimal Blue issues the Market Advantage mortgage data report each month to provide early insight into U.S. mortgage trends. Leveraging lender rate lock data from the Optimal Blue PPE – the mortgage industry’s most widely used product, pricing, and eligibility engine – the Market Advantage provides a view of early-stage origination activity. Unlike self-reported survey data, mortgage lock data is direct-source data that accurately reflects the in-process loans in lenders’ pipelines.

Nothing herein shall be construed as, nor is Optimal Blue providing, any legal, trading, hedging, or financial advice.

About Optimal Blue

Optimal Blue effectively bridges the primary and secondary mortgage markets to deliver the industry’s only end-to-end capital markets platform. The company helps lenders of all sizes and scopes maximize profitability and operate efficiently so they can help American borrowers achieve the dream of homeownership. Through innovative technology, a network of interconnectivity, rich data insights, and expertise gathered over more than 20 years, Optimal Blue is an experienced partner that, in any market environment, allows lenders to optimize their advantage from pricing accuracy to margin protection, and every step in between. To learn more, visit https://OptimalBlue.com/.

MULTIMEDIA:

Image link for media: https://www.Send2Press.com/300dpi/25-0513-s2p-opbluapril-300dpi.jpg

Image caption: Optimal Blue’s April 2025 Market Advantage mortgage data report.

NEWS SOURCE: Optimal Blue


This press release was issued on behalf of the news source (Optimal Blue), who is solely responsible for its accuracy, by Send2Press Newswire. Image, if any, was provided by the news source and not this website or the wire service. Information is believed accurate, as provided by the news source, but is not guaranteed.

To view the original story, visit: https://www.send2press.com/wire/lock-volume-rises-3-2-in-april-driven-by-uptick-in-fha-loans-despite-economic-volatility/

Copr. © 2025 Send2Press® Newswire, Calif., USA. -- REF: S2P STORY ID: S2P126135 NOREL-3B
 

Cooler Interest Rates Heat Up Refinances and Spark Early Signs of Purchase Demand

Optimal Blue's March 2025 Market Advantage report shows an increase in non-conforming share as buyers seek greater flexibility and higher loan limits

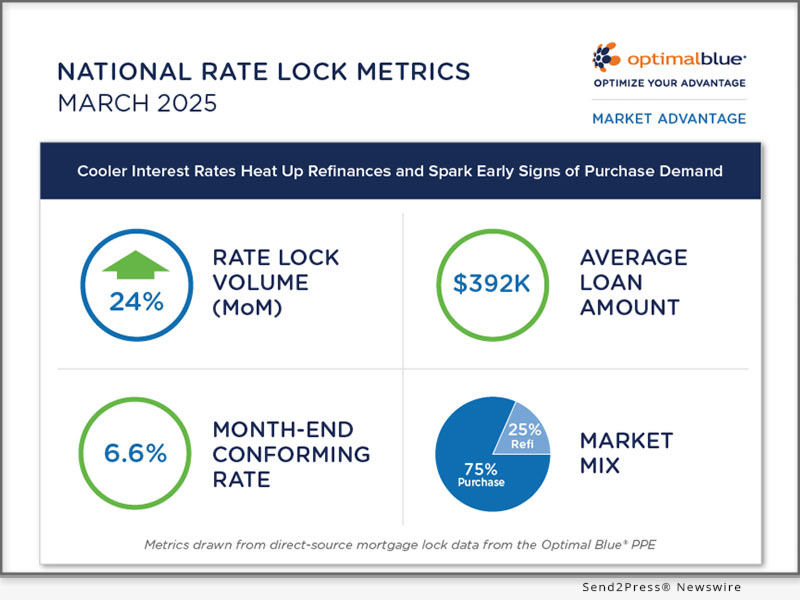
PLANO, Texas, April 8, 2025 (SEND2PRESS NEWSWIRE) — Optimal Blue today released its March 2025 Market Advantage mortgage data report, showing a 24% surge in rate lock volume as early spring buyers returned to the market and homeowners jumped at the chance to refinance into lower rates. While still down 2% on a year-over-year (YoY) basis, purchase volumes were up 21% month-over-month (MoM). Rate-and-term and cash-out refinances jumped 52% and 20% MoM, respectively, together representing 25% of all lock activity.

Optimal Blue's March 2025 Market Advantage mortgage data report.
Image caption: Optimal Blue’s March 2025 Market.

“March brought a notable shift in borrower behavior,” said Brennan O’Connell, director of data solutions at Optimal Blue. “Refinances made up a quarter of all lock activity for the first time in six months, and we saw a clear rise in non-conforming loan share as buyers looked for more flexible options and higher loan amounts. These are key indicators that consumers are actively adapting to the current rate environment.”

Key findings from the Market Advantage report, derived from direct-source mortgage lock data, include:

  • Refinances take share from purchase loans: Strong growth in refi activity during March pushed the share of refinances up to 25%, the highest level seen since September 2024. The pull-through rate for refinances was 63.3%.
  • Purchase volume up MoM, but down YoY: Despite positive MoM momentum, purchase activity was down 2% YoY. Isolating loan counts instead of dollar volume – effectively controlling for home price appreciation – reveals an even steeper 6% decline in purchase activity. The pull-through rate for purchase loans was 82.9%.
  • Non-conforming share rises: Conforming loan production continued to hover near historic lows, while non-Agency loan share hit its highest level since April of 2022. Non-conforming loans, which include jumbo and non-QM loans, accounted for 16.8% of total rate lock volume. Conforming loan share fell to 51% and FHA share dropped to 19.6%, while VA volume inched upward, reaching nearly 12% share.
  • Adjustable-rate mortgages gain steam: ARMs accounted for just below 9% of total rate lock volume in March, a result tied to growing demand for non-conforming loan options. Optimal Blue will continue to monitor this data point as buyers search for greater affordability.
  • Rates stay relatively flat: After a strong rally the last week of February, the OBMMI 30-year conforming fixed rate – the benchmark for the CME Group’s Mortgage Rate futures – finished the month flat at 6.6%. FHA rates fell 8 basis points (bps) to 6.27%, while VA and jumbo rates rose a modest 3 and 4 bps to 6.13% and 6.73%, respectively.
  • Refi credit quality ticks higher: March saw a 3-point increase in average credit scores for both cash-out and rate-and-term refinances, rising to 735 and 699, respectively, as higher-credit homeowners acted quickly on refinance opportunities.
  • DTI trends downward: The average debt-to-income (DTI) ratio across all loans dropped from February’s 37.3% to 36.7% in March, reflecting income growth outpacing the rise in household debt [*note 1]. This fall in DTI represents a healthier balance between monthly income and debt than tracked in previous months.
  • Loan sizes grow alongside home prices: The average home purchase price rose from February’s $480.2K to $486.9K in March, driving a MoM increase in average loan amount from $380.5K to $391.7K.

The full Market Advantage report, which provides more detailed findings and additional insights into U.S. mortgage market trends, can be viewed at (PDF): https://www2.optimalblue.com/wp-content/uploads/2025/04/OB_MarketAdvantage_MortgageDataReport_Mar2025.pdf

This month’s Market Advantage podcast features Optimal Blue Head of Corporate Strategy Mike Vough, offering additional market insights. Watch or listen to the episode: https://market-advantage.captivate.fm/episode/episode-7/.

About the Market Advantage Report

Optimal Blue issues the Market Advantage mortgage data report each month to provide early insight into U.S. mortgage trends. Leveraging lender rate lock data from the Optimal Blue PPE – the mortgage industry’s most widely used product, pricing, and eligibility engine – the Market Advantage provides a view of early-stage origination activity. Unlike self-reported survey data, mortgage lock data is direct-source data that accurately reflects the in-process loans in lenders’ pipelines.

Nothing herein shall be construed as, nor is Optimal Blue providing, any legal, trading, hedging, or financial advice.

About Optimal Blue

Optimal Blue effectively bridges the primary and secondary mortgage markets to deliver the industry’s only end-to-end capital markets platform. The company helps lenders of all sizes and scopes maximize profitability and operate efficiently so they can help American borrowers achieve the dream of homeownership. Through innovative technology, a network of interconnectivity, rich data insights, and expertise gathered over more than 20 years, Optimal Blue is an experienced partner that, in any market environment, allows lenders to optimize their advantage from pricing accuracy to margin protection, and every step in between. To learn more, visit OptimalBlue.com.

NOTE/CITATION:

[1] https://libertystreeteconomics.newyorkfed.org/2024/11/income-growth-outpaces-household-borrowing/

NEWS SOURCE: Optimal Blue


This press release was issued on behalf of the news source (Optimal Blue), who is solely responsible for its accuracy, by Send2Press Newswire. Image, if any, was provided by the news source and not this website or the wire service. Information is believed accurate, as provided by the news source, but is not guaranteed.

To view the original story, visit: https://www.send2press.com/wire/cooler-interest-rates-heat-up-refinances-and-spark-early-signs-of-purchase-demand/

Copr. © 2025 Send2Press® Newswire, Calif., USA. -- REF: S2P STORY ID: S2P125367 NOREL-3B
 

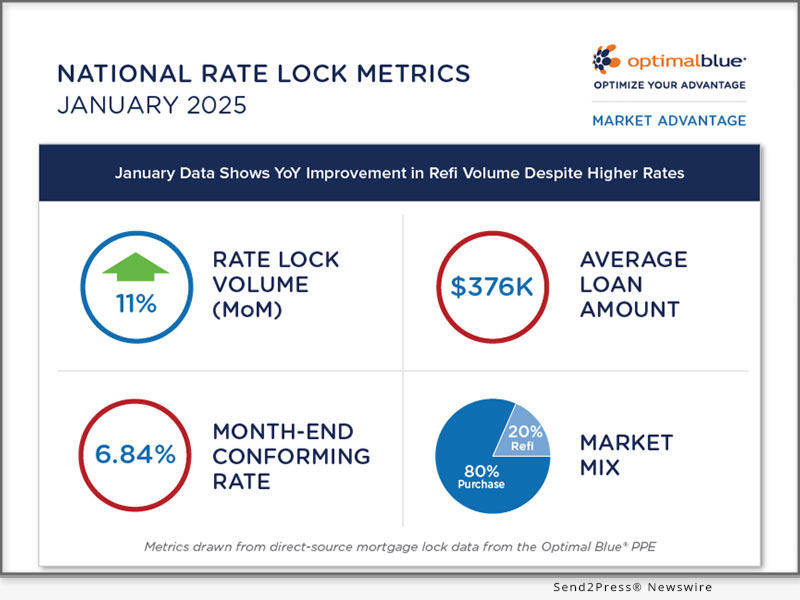
January Mortgage Lock Data Shows Year-Over-Year Improvement in Refinance Volume Despite Higher Rates

Optimal Blue's January 2025 Market Advantage mortgage data report highlights a softening purchase market, boost in refi demand among elevated rates

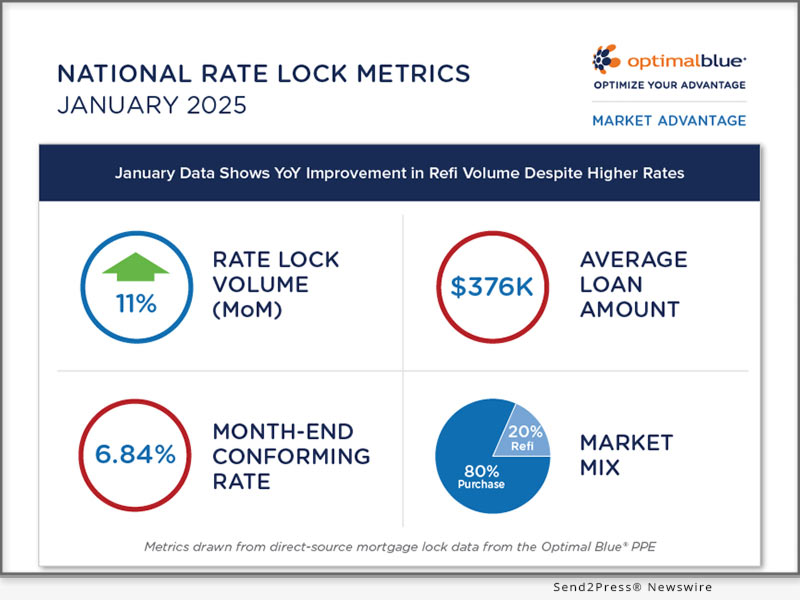
PLANO, Texas, Feb. 13, 2025 (SEND2PRESS NEWSWIRE) — Optimal Blue today released its January 2025 Market Advantage mortgage data report, revealing a sharp rise in year-over-year (YoY) refinance activity alongside a drop in purchase lock counts. The decline in purchase lock counts marks the lowest January count since Optimal Blue began tracking this data in 2019. Meanwhile, refinance lock volume surged even though the Optimal Blue Mortgage Market Indices (OBMMI) 30-year ticked above 7% for the first time since May.

Optimal Blue's January 2025 Market Advantage mortgage data report
Image caption: Optimal Blue’s January 2025 Market Advantage mortgage data report.

“January lock data shows two important ways constrained affordability is impacting the housing finance market. On one hand, refinance activity saw impressive YoY growth despite elevated rates, signaling a growing pool of homeowners with mortgage rates high enough to justify a refinance. On the other hand, purchase lock counts declined YoY, marking the lowest January figures since we began tracking this data in 2019,” said Brennan O’Connell, director of data solutions at Optimal Blue. “A combination of high home prices and rates are curbing purchase activity, while at the same time fueling refinance demand among homeowners who purchased when rates were even higher.”

Key findings from the Market Advantage report, derived from direct-source mortgage lock data, include:

  • Refinance activity surges YoY: Despite rates remaining above 6.8%, total refinance lock volume grew more than 20% YoY for both rate-and-term and cash-out refinances. This indicates that a growing share of borrowers with higher-rate mortgages are finding opportunities to refinance, such as those who purchased between August and November of 2023.
  • Purchase lock volume rises MoM but declines YoY: Purchase lock volume climbed 16% from December, reflecting typical seasonal momentum at the start of the year. However, YoY purchase lock counts – which control for home price appreciation – were down 6%, marking the lowest January figures in six years. This follows a strong end to 2024 and will be an important trend to watch moving forward.
  • Rates hold steady after an early-month jump: The OBMMI 30-year conforming rate started January above 7% but rallied late in the month, ending at 6.84% (up just 1 basis point). Other key rate indices followed a similar pattern, with jumbo rates up 2 bps, FHA rates unchanged, and VA rates up 4 bps.
  • Conforming loan share remains near record lows: After hitting a multi-year low in December, conforming loan share edged up slightly to 51% of total production but remained near historical lows. This was offset by small declines in nonconforming and FHA loan share. VA lending share held steady.
  • Credit scores show mixed trends: The average credit score for purchase and rate-and-term refinance loans rose by 1 point to 738 and 728, respectively. Meanwhile, the average credit score for cash-out refinances declined by 4 points to 693.
  • Home prices increase while loan amounts remain stable: The average home purchase price rose from $473.7K to $476.2K, while the average loan amount dipped slightly from $376.9K to $376.4K.

The full Market Advantage report, which provides more detailed findings and additional insights into U.S. mortgage market trends, can be viewed at (PDF): https://www2.optimalblue.com/wp-content/uploads/2025/02/OB_MarketAdvantage_MortgageDataReport_Jan2025.pdf.

This month’s Market Advantage podcast, which was recorded on-site at the Optimal Blue Summit, features HousingWire Editor in Chief Sarah Wheeler as a guest commentator. Access the podcast: https://market-advantage.captivate.fm/listen.

About the Market Advantage Report:

Optimal Blue issues the Market Advantage mortgage data report each month to provide early insight into U.S. mortgage trends. Leveraging lender rate lock data from the Optimal Blue PPE – the mortgage industry’s most widely used product, pricing, and eligibility engine – the Market Advantage provides a view of early-stage origination activity. Unlike self-reported survey data, mortgage lock data is direct-source data that accurately reflects the in-process loans in lenders’ pipelines.

Nothing herein shall be construed as, nor is Optimal Blue providing, any legal, trading, hedging, or financial advice.

About Optimal Blue:

Optimal Blue effectively bridges the primary and secondary mortgage markets to deliver the industry’s only end-to-end capital markets platform. The company helps lenders of all sizes and scopes maximize profitability and operate efficiently so they can help American borrowers achieve the dream of homeownership. Through innovative technology, a network of interconnectivity, rich data insights, and expertise gathered over more than 20 years, Optimal Blue is an experienced partner that, in any market environment, allows lenders to optimize their advantage from pricing accuracy to margin protection, and every step in between. To learn more, visit https://OptimalBlue.com/.

NEWS SOURCE: Optimal Blue


This press release was issued on behalf of the news source (Optimal Blue), who is solely responsible for its accuracy, by Send2Press Newswire. Image, if any, was provided by the news source and not this website or the wire service. Information is believed accurate, as provided by the news source, but is not guaranteed.

To view the original story, visit: https://www.send2press.com/wire/january-mortgage-lock-data-shows-year-over-year-improvement-in-refinance-volume-despite-higher-rates/

Copr. © 2025 Send2Press® Newswire, Calif., USA. -- REF: S2P STORY ID: S2P124020 NOREL-3B
 

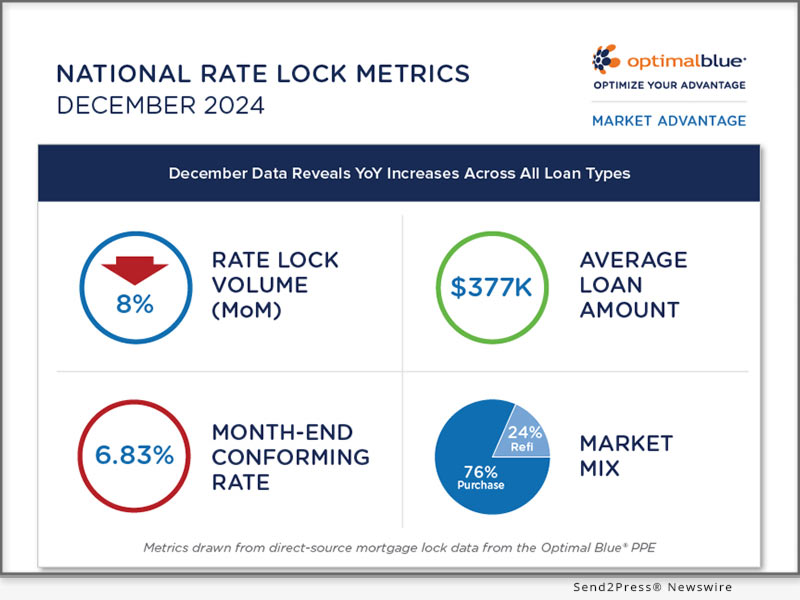
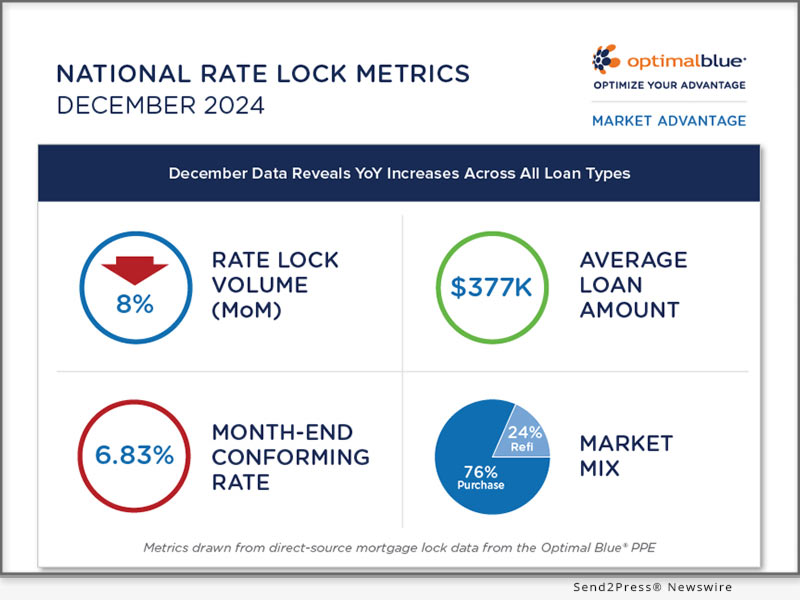
December Mortgage Lock Data Reveals Year-Over-Year Increases Across All Loan Types Despite Seasonal Downturn

Optimal Blue's December 2024 Market Advantage report highlights annual mortgage production gains and record low conforming loan share

PLANO, Texas, Jan. 14, 2025 (SEND2PRESS NEWSWIRE) — Optimal Blue today released its December 2024 Market Advantage mortgage data report, showcasing year-over-year (YoY) growth in mortgage activity, even as seasonal trends led to a month-over-month (MoM) decline in rate lock volumes. Overall, December mortgage lock volume was up 26% YoY, driven by an 18% increase in purchase locks, a 43% rise in cash-out refinances, and an 82% jump in rate-and-term refinances.

Optimal Blue December 2024 Market Advantage report
Image caption: Optimal Blue December 2024 Market Advantage report.

“December’s data illustrates how the market can adapt to shifting conditions,” said Brennan O’Connell, director of data solutions at Optimal Blue. “While a seasonal dip was expected, the year-over-year growth reflects resilience and an increasing demand for refinance opportunities driven by rate adjustments. Notably, conforming loan share has hovered around historic lows for the past five months, hitting 51% last month. This trend illustrates how borrowers are relying increasingly on government and non-conforming loans to finance in a challenging market.”

Key findings from the Market Advantage report, derived from direct-source mortgage lock data, include:

  • Rates fluctuate, ending December higher: After initial declines, rates rose throughout the month. The Optimal Blue Mortgage Market Indices (OBMMI) 30-year conforming rate ended December at 6.83%, up 16 bps from the end of November. FHA and VA rates followed suit, rising 14 bps and 18 bps, respectively. Jumbo rates fell slightly, ending just below 7%.
  • Refinance activity spikes: The share of refinance locks climbed to 24%, the highest since September. Rate-and-term refinances surged 33% MoM, while cash-out refinances saw a 3% decline. Purchase volumes dropped 13% MoM, in line with seasonal norms, while cash-out refinances decreased 3%.
  • Production mix shifts continue: The conforming loan share dropped another 1.5% MoM to 51%, the lowest figure since Optimal Blue began reporting lock data in January 2018, marking continued movement away from GSE-eligible products. FHA, VA, and non-conforming loans gained ground, with FHA locks rising to 21%, VA at nearly 11.5%, and non-conforming loans at 16%.
  • Purchase credit quality hits seven-year high: Average homebuyer credit scores were higher each month in 2024 than the previous 72 months.
  • MoM credit trends are stable: Average credit scores for purchase and rate-and-term refinance locks fell by 2 points to 737 and 727, respectively. Cash-out refinance scores rose slightly, increasing by 2 points to 697.
  • Loan amounts plateau as home prices decline: The average loan amount rose by $500 to $376.9K, while average home purchase prices dropped $4.1K to $473.7K.

The full Market Advantage report, which provides more detailed findings and additional insights into U.S. mortgage market trends, can be viewed at: https://www2.optimalblue.com/wp-content/uploads/2025/01/OB_MarketAdvantage_MortgageDataReport_Dec2024.pdf

This month’s Market Advantage podcast features Shant Banosian, executive vice president of sales at Rate, as a guest commentator. Access the podcast: https://market-advantage.captivate.fm/listen.

About the Market Advantage Report

Optimal Blue issues the Market Advantage mortgage data report each month to provide early insight into U.S. mortgage trends. Leveraging lender rate lock data from the Optimal Blue PPE – the mortgage industry’s most widely used product, pricing, and eligibility engine – the Market Advantage provides a view of early-stage origination activity. Unlike self-reported survey data, mortgage lock data is direct-source data that accurately reflects the in-process loans in lenders’ pipelines.

Nothing herein shall be construed as, nor is Optimal Blue providing, any legal, trading, hedging, or financial advice.

About Optimal Blue

Optimal Blue effectively bridges the primary and secondary mortgage markets to deliver the industry’s only end-to-end capital markets platform. The company helps lenders of all sizes and scopes maximize profitability and operate efficiently so they can help American borrowers achieve the dream of homeownership. Through innovative technology, a network of interconnectivity, rich data insights, and expertise gathered over more than 20 years, Optimal Blue is an experienced partner that, in any market environment, allows lenders to optimize their advantage from pricing accuracy to margin protection, and every step in between. To learn more, visit https://OptimalBlue.com/.

NEWS SOURCE: Optimal Blue


This press release was issued on behalf of the news source (Optimal Blue), who is solely responsible for its accuracy, by Send2Press Newswire. Image, if any, was provided by the news source and not this website or the wire service. Information is believed accurate, as provided by the news source, but is not guaranteed.

To view the original story, visit: https://www.send2press.com/wire/december-mortgage-lock-data-reveals-year-over-year-increases-across-all-loan-types-despite-seasonal-downturn/

Copr. © 2025 Send2Press® Newswire, Calif., USA. -- REF: S2P STORY ID: S2P123332 NOREL-3B
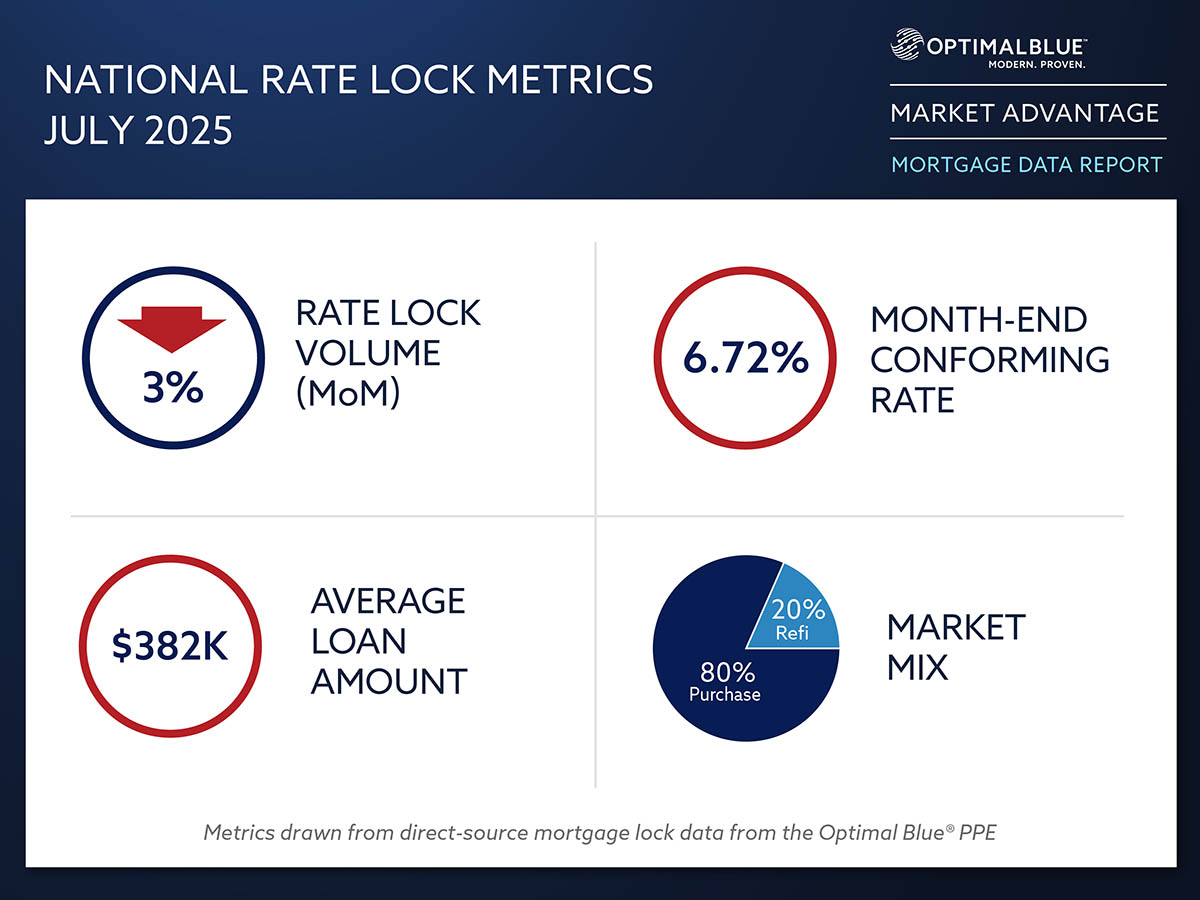
 

Mortgage Lock Activity Fell in November as Interest Rates Hit Their Highest Levels Since July

Optimal Blue's November 2024 Market Advantage mortgage data report finds overall rate lock volume down 25% month over month, yet 12% higher year over year, providing some reason for optimism

PLANO, Texas, Dec. 10, 2024 (SEND2PRESS NEWSWIRE) — Optimal Blue today released its November 2024 Market Advantage mortgage data report, highlighting a 25% decrease in month-over-month (MoM) lock volume as interest rates hit their highest levels since early July, creating headwinds for affordability.

Optimal Blue November 2024 Market Advantage mortgage data report
Image caption: Optimal Blue November 2024 Market Advantage mortgage data report.

Purchase lock volume was down 21% MoM, while cash-out and rate-and-term refinance volumes fell 20% and 50%, respectively. However, year-over-year (YoY) metrics show resilience in the market, with total rate lock volume up 12% from November 2023, purchase volume up a modest 5%, and cash-out and rate-and-term refinances increasing 35% and 95%, respectively, sparking optimism among market watchers.

While high rates prevailed for much of the month, they dropped slightly in the week leading up to the Thanksgiving holiday. The OBMMI 30-year conforming fixed rate index, the benchmark that will be used as the underlying price for CME Group’s new Mortgage Rate futures, finished the month down 11 bps from October. FHA and VA 30-year rates fell as well, closing the month down 7 bps and 20 bps, respectively. The 30-year jumbo rate showed a slight increase to close the month, up 16 bps from the end of October.

Product mix changes mirrored the month’s affordability concerns. FHA loans, which offer as little as 3.5% down and more lenient credit requirements, gained share at the expense of all other loan types, notching up another three-quarters of a point to account for 20% of total production. That puts FHA market share back near its peak of just over 22% of total production in November 2023. VA loan volume fell in November, but is up YoY at 11% of total volume. Government production in total accounted for nearly one-third of loan volume in November.

“The rising percentage of FHA loans indicates affordability continues to be a concern among homebuyers as we move into year-end,” said Brennan O’Connell, director of data solutions at Optimal Blue. “In spite of the recent dip in purchase and refinance activity, we see the YoY improvements in purchase volume, cash-out and rate-and-term refinances as a bright spot.”

Key findings from the Market Advantage report, which are drawn from direct-source mortgage lock data, include:

  • Rates dip slightly for conforming and government-backed loans: The OBMMI 30-year conforming averaged 30 bps higher in November, though it ended the month at 6.68%, an 11-bps decrease from October. FHA rates dropped by 7 bps to 6.36%, while VA rates dropped 20 bps to 6.16%. The OBMMI jumbo index rate rose a more moderate 16 bps, ending the month at 6.98%.
  • Purchase lock volume softens: Purchase lock volume was down 21% MoM. Also significant, purchase lock counts – which are a key measure for market health that excludes the impact of HPA and volatile refi activity – were down 3% YoY, breaking a two-month trend of positive YoY momentum.
  • Conforming loan share continues to fall: Conforming share ended the month below 53%, roughly 20% lower than the peak levels seen in 2020. Non-conforming lending – including both non-QM and jumbo – fell slightly in November. Nevertheless, non-conforming loans remained near their recent market share high at just under 15% – a nearly five-percentage-point increase in market share over the same period last year.
  • Refinance demand softens: Cash-out and rate-and-term refinance volumes fell 20% and 50%, respectively. However, YoY metrics provide reason for optimism with cash-out and rate-and-term refinances gaining 35% and 95% YoY, respectively.
  • Credit quality holds steady: Average credit scores for purchase loans were flat at 739, while average scores on refinance locks dropped slightly. Cash-out average credit fell 2 points to 695, and rate-and-term average credit dropped 1 point to 730.
  • Home prices and average loan amounts dip: In November, the average loan amount dropped from $380.1K to $376.4K. Average home purchase prices ticked down as well, falling from $482.4K to $477.4K.

The full November 2024 Market Advantage report, which provides more detailed findings and additional insights into U.S. mortgage market trends, can be viewed at: https://www2.optimalblue.com/wp-content/uploads/2024/12/OB_MarketAdvantage_MortgageDataReport_Nov2024.pdf.

This month’s Market Advantage podcast features Agha Mirza, CME Group managing director and global head of rates and OTC products, a guest commentator. The podcast can be accessed at: https://market-advantage.captivate.fm/listen.

About the Market Advantage Report:

Optimal Blue issues the Market Advantage mortgage data report each month to provide early insight into U.S. mortgage trends. Leveraging lender rate lock data from the Optimal Blue PPE – the mortgage industry’s most widely used product, pricing, and eligibility engine – the Market Advantage provides a view of early-stage origination activity. Unlike self-reported survey data, mortgage lock data is direct-source data that accurately reflects the in-process loans in lenders’ pipelines.

Nothing herein shall be construed as, nor is Optimal Blue providing, any legal, trading, hedging, or financial advice.

About Optimal Blue:

Optimal Blue effectively bridges the primary and secondary mortgage markets to deliver the industry’s only end-to-end capital markets platform. The company helps lenders of all sizes and scopes maximize profitability and operate efficiently so they can help American borrowers achieve the dream of homeownership. Through innovative technology, a network of interconnectivity, rich data insights, and expertise gathered over more than 20 years, Optimal Blue is an experienced partner that, in any market environment, allows lenders to optimize their advantage from pricing accuracy to margin protection, and every step in between. To learn more, visit OptimalBlue.com.

MULTIMEDIA:

Image link for media: https://www.Send2Press.com/300dpi/24-1210-s2p-opbluenovreport-300dpi.jpg

NEWS SOURCE: Optimal Blue


This press release was issued on behalf of the news source (Optimal Blue), who is solely responsible for its accuracy, by Send2Press Newswire. Image, if any, was provided by the news source and not this website or the wire service. Information is believed accurate, as provided by the news source, but is not guaranteed.

To view the original story, visit: https://www.send2press.com/wire/mortgage-lock-activity-fell-in-november-as-interest-rates-hit-their-highest-levels-since-july/

Copr. © 2024 Send2Press® Newswire, Calif., USA. -- REF: S2P STORY ID: S2P122703 NOREL-3B
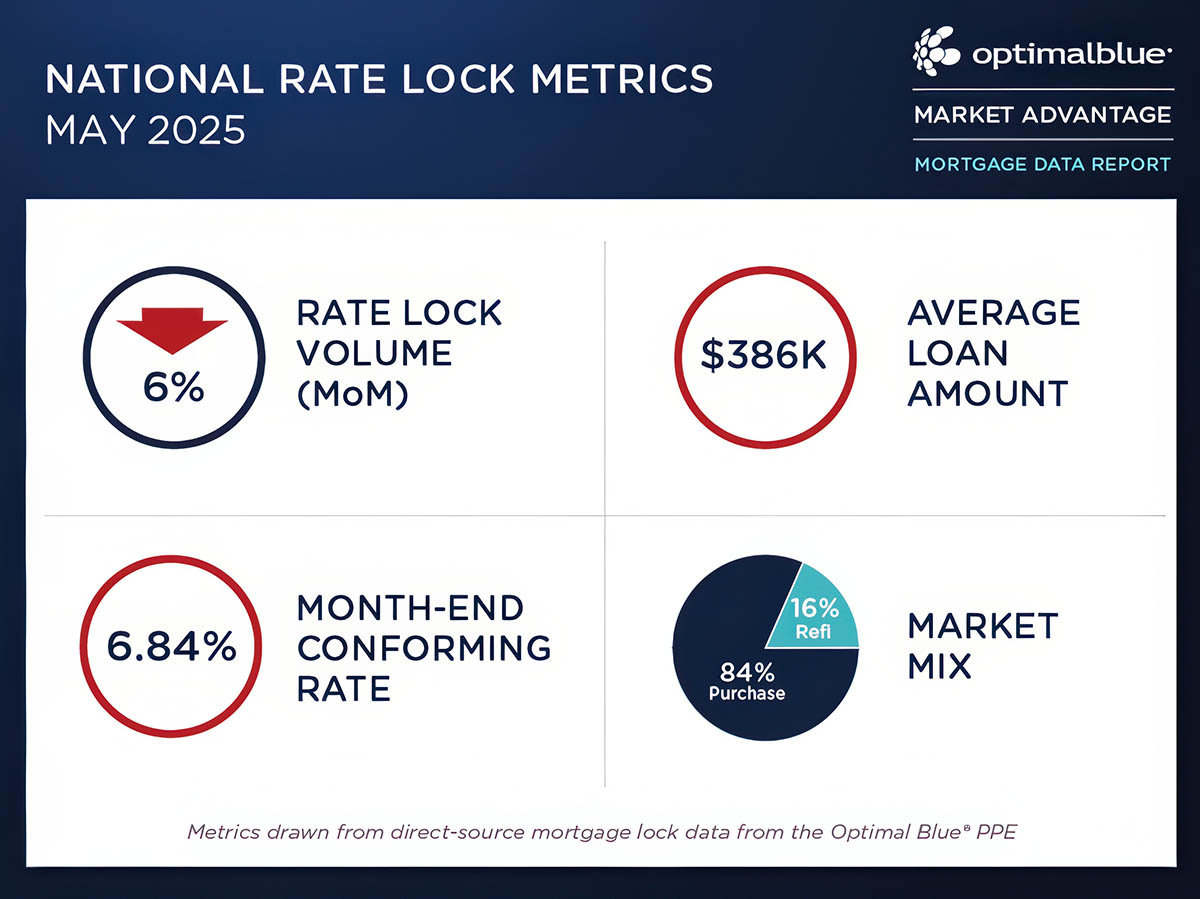
 

Rate-and-Term Refinance Locks Surge 700% Over Previous Year Following the FOMC’s September Interest Rate Reduction

Optimal Blue's September 2024 Market Advantage mortgage data report released in conjunction with the inaugural Market Advantage podcast featuring Mortgage Bankers Association economist Joel Kan guest commentator

PLANO, Texas, Oct. 8, 2024 (SEND2PRESS NEWSWIRE) — Optimal Blue today released its September 2024 Market Advantage mortgage data report, which found a 50% month-over-month (MoM) increase in rate-and-term refinance activity as people who purchased homes in recent years jumped at the opportunity to lower their interest rates and mortgage payments. While the Federal Open Market Committee (FOMC) lowered its target federal funds rate by 50 bps on Sept. 18, the market had already priced in a portion of the rate reduction, leading to a full month of increased refinance activity in September.

Optimal Blue Sept. 2024 Report
Image caption: Optimal Blue Sept. 2024 Report.

“Refinance production has been trending higher for a few months now as mortgage rates rallied, but purchase activity had been stubbornly stagnant. However, September volumes indicate the tide may be turning,” said Brennan O’Connell, director of data solutions at Optimal Blue. “Excluding April of this year, which was impacted by the timing of Easter, September marks the first month with a year-over-year (YoY) increase in purchase locks since the Fed began raising rates in Spring of 2022. As we move into Q4, this is a very encouraging sign that the market may have found a floor and production is on the upswing.”

Key findings from the Market Advantage report, which are drawn from direct-source mortgage lock data, include:

  • Refinance volumes surge: On an absolute basis, refinance production reached the highest level seen since January 2022. Rate-and-term refinance lock volume was up nearly 50% MoM and 700% YoY. Cash-out refinance volume rose a more modest 6% MoM but was still up more than 50% YoY.
  • Mortgage rates fall across the board: The Optimal Blue Mortgage Market Indices (OBMMI) 30-year conforming benchmark interest rate dropped 23 bps, while jumbo, FHA, and VA rates were down 22, 25, and 16 bps, respectively. The drop in mortgage interest rates did not directly correspond to the 50 bps FOMC rate cut because an anticipatory market had already priced a reduction in rates leading into September.
  • Conventional and VA production grew market share: The share of conforming loan production rose roughly .5% to 54.4%, and the share of non-conforming production – including jumbo and non-QM loans – rose .25% to 12.6%. The share of FHA loans fell roughly 1% to 18.7%, while VA rose .2% to 13.7%.
  • Average borrower credit increased across the board: The credit scores of rate-and-term refinance borrowers rose an average of 6 points to 737. The average conventional borrower credit score rose to 757, the highest since December 2020.
  • Average loan amounts and home prices rose: From August 2024 to September 2024, the average loan amount increased from $372.4K to $383.7K. The average home purchase price ticked up $10K to $475.8K after falling the previous two months.

The inaugural Market Advantage podcast has been released today in conjunction with the September Report. This month’s podcast features Joel Kan, vice president and deputy chief economist at the Mortgage Bankers Association, as a guest commentator. The podcast can be accessed at: https://market-advantage.captivate.fm/listen.

The full September 2024 Market Advantage report, which provides more detailed findings and additional insights into U.S. mortgage market trends, can be viewed at: https://www2.optimalblue.com/wp-content/uploads/2024/10/OB_MarketAdvantage_MortgageDataReport_Sept2024.pdf.

About the Market Advantage Report:

Formerly known as the Originations Market Monitor, Optimal Blue issues the Market Advantage mortgage data report each month to provide early insight into U.S. mortgage trends. Leveraging lender rate lock data from the Optimal Blue PPE – the mortgage industry’s most widely used product, pricing, and eligibility engine – the Market Advantage provides a view of early-stage origination activity. Unlike self-reported survey data, mortgage lock data is direct-source data that accurately reflects the in-process loans in lenders’ pipelines.

Nothing herein shall be construed as, nor is Optimal Blue providing, any legal, trading, hedging, or financial advice.

About Optimal Blue

Optimal Blue effectively bridges the primary and secondary mortgage markets to deliver the industry’s only end-to-end capital markets platform. The company helps lenders of all sizes and scopes maximize profitability and operate efficiently so they can help American borrowers achieve the dream of homeownership. Through innovative technology, a network of interconnectivity, rich data insights, and expertise gathered over more than 20 years, Optimal Blue is an experienced partner that, in any market environment, allows lenders to optimize their advantage from pricing accuracy to margin protection, and every step in between. To learn more, visit https://OptimalBlue.com/.

LOGO link for media: https://www.Send2Press.com/300dpi/14-0625-s2p-optimal-blue-300dpi.jpg

NEWS SOURCE: Optimal Blue


This press release was issued on behalf of the news source (Optimal Blue), who is solely responsible for its accuracy, by Send2Press Newswire. Image, if any, was provided by the news source and not this website or the wire service. Information is believed accurate, as provided by the news source, but is not guaranteed.

To view the original story, visit: https://www.send2press.com/wire/rate-and-term-refinance-locks-surge-700-over-previous-year-following-the-fomcs-september-interest-rate-reduction/

Copr. © 2024 Send2Press® Newswire, Calif., USA. -- REF: S2P STORY ID: S2P121327 NOREL-3B
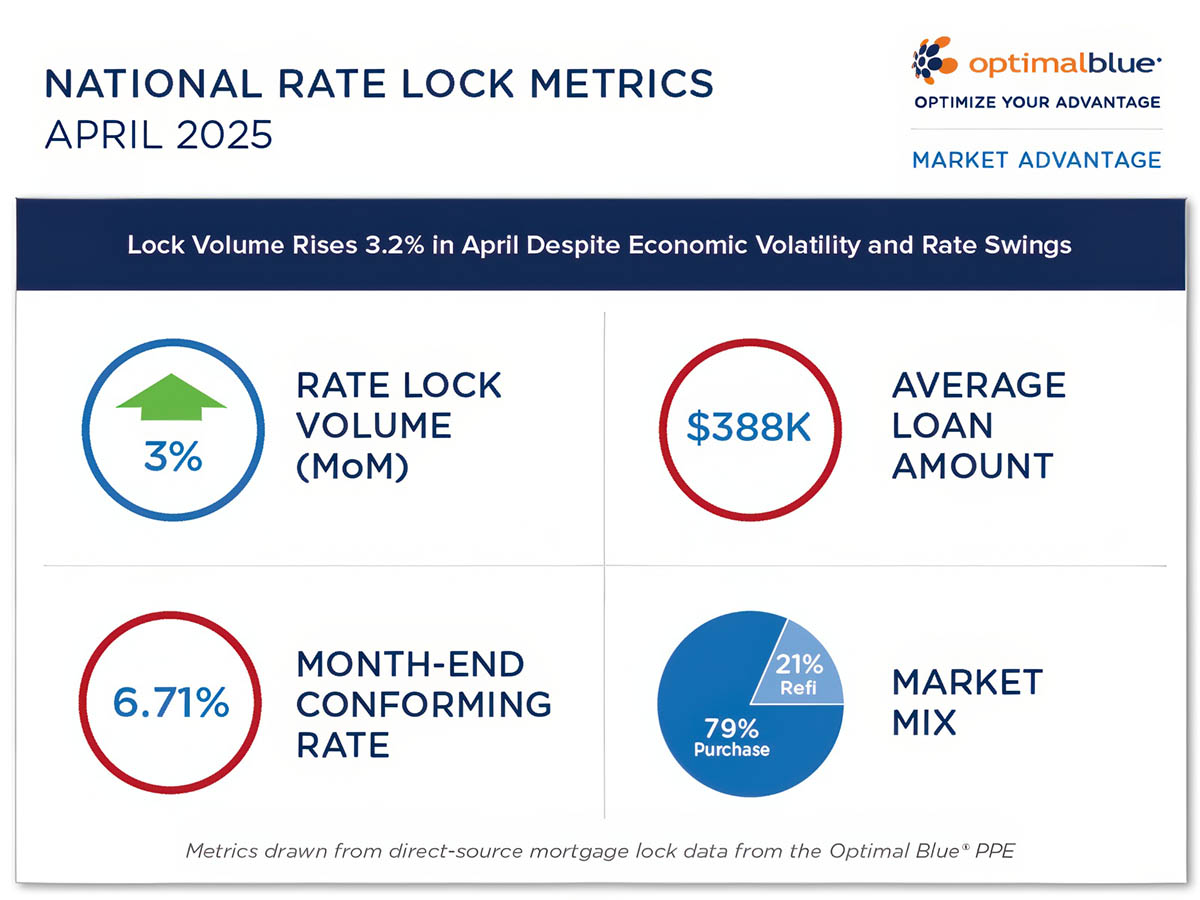
 

July Refinance Activity Hits Highest Levels Since September 2022

PLANO, Texas /ScoopCloud/ -- Optimal Blue today released its July 2024 Market Advantage mortgage data report, which revealed that mortgage refinance demand surged to levels not seen since September 2022 amid softening interest rates. The lower interest rates seen in July also coaxed increased purchase activity, which, combined with greater refi activity, drove a 3.5% month-over-month (MoM) increase in mortgage rate lock volumes.

"The July report shows a notable uptick in refinance activity, particularly rate-and-term refinances, which jumped 12% as borrowers responded to declining interest rates," said Brennan O'Connell, director of data solutions at Optimal Blue. "The drop in the Optimal Blue Mortgage Market Indices 30-year conforming rate to 6.67% played a significant role in this growth, and we observed the highest level of refinance activity since September 2022."

Key findings from the Market Advantage report, which are drawn from direct-source mortgage lock data, are:

* Increase in rate lock volume: Overall rate lock volume rose by 3.5% MoM, with purchase activity up 2.5% and refinance activity showing even stronger growth. Cash-out refinance volume grew by 5.9% MoM, while rate-and-term refinance activity surged 12.3%, reflecting borrower sensitivity to lower rates.

* Purchase lock count growth: Purchase lock counts grew by 2.5% MoM in July, though they remained down 7% year-over-year (YoY). This is a significant improvement over June's 17% YoY decline, suggesting a potential stabilization in purchase demand as the market adjusts.

* Refinance activity surge: Refinance activity reached its highest level since September 2022, with the refinance share growing to 17% of total volume - an 81-basis-point increase from June and a 472-basis-point rise YoY. This aligns with trends in the OBMMI 30-year conforming rate, which ended July 2024 at 6.67%, nearly identical to the 6.68% rate that closed out September in 2022.

* Rate and treasury movements: The OBMMI 30-year conforming rate ended July at 6.67%, down 26 basis points from June. Meanwhile, the 10-year Treasury yield dropped by 27 basis points to 4.09%. The spread between the 30-year conforming rate and the 10-year Treasury remained stable at 258 basis points, an uptick of just 1 basis point.

* Shift in loan mix: The loan mix in July shifted toward agency production. Conforming loans increased market share to 56.1% (+18 bps), FHA loans grew to 19.0% (+61 bps), and VA loans rose to 11.9% (+22 bps). Conversely, non-conforming loans, including jumbo and non-QM, saw a decline in market share, falling to 12.4% (-107 bps).

* Decrease in average loan amount: The average loan amount decreased from $374K in June to $369K in July, reflecting the shift away from non-conforming loan types.

* Stable credit quality: Credit scores remained stable, with the average score holding steady at 732.

The full July 2024 Market Advantage report provides more detailed findings and additional insights into U.S. mortgage market trends (PDF): https://www2.optimalblue.com/wp-content/uploads/2024/08/OB_MarketAdvantage_MortgageDataReport_July2024.pdf.

About the Market Advantage Report:

Formerly known as the Originations Market Monitor, Optimal Blue issues the Market Advantage mortgage data report each month to provide early insight into U.S. mortgage trends. Leveraging lender rate lock data from the Optimal Blue PPE - the mortgage industry's most widely used product, pricing, and eligibility engine - the Market Advantage provides a view of early-stage origination activity. Unlike self-reported survey data, mortgage lock data is direct-source data that accurately reflects the in-process loans in lenders' pipelines.

Nothing herein shall be construed as, nor is Optimal Blue providing, any legal, trading, hedging, or financial advice.

About Optimal Blue

Optimal Blue effectively bridges the primary and secondary mortgage markets to deliver the industry's only end-to-end capital markets platform. The company helps lenders of all sizes and scopes maximize profitability and operate efficiently so they can help American borrowers achieve the dream of homeownership. Through innovative technology, a network of interconnectivity, rich data insights, and expertise gathered over more than 20 years, Optimal Blue is an experienced partner that, in any market environment, allows lenders to optimize their advantage from pricing accuracy to margin protection, and every step in between. To learn more, visit https://OptimalBlue.com/.

News from Optimal Blue

Optimal Blue today released its July 2024 Market Advantage mortgage data report, which revealed that mortgage refinance demand surged to levels not seen since September 2022 amid softening interest rates. The lower interest rates seen in July also coaxed increased purchase activity, which, combined with greater refi activity, drove a 3.5% month-over-month (MoM) increase in mortgage rate lock volumes.

Related link: https://www2.optimalblue.com/

This version of news story was published on ScoopCloud™ (ScoopCloud.com) - part of and © the Neotrope® News Network - all rights reserved.

Falling Home Prices and Purchase Mortgage Locks Reveal a Stagnant Late-Spring Housing Market

PLANO, Texas /ScoopCloud/ -- Optimal Blue today released its June 2024 Market Advantage mortgage data report, which revealed a stagnant late-spring housing market as home prices dropped for the first time in 2024 and purchase lock counts fell 8% over the previous year. All mortgage lock figures in this news release have been controlled for fewer market days in June.

"Despite an improvement in interest rates, purchase activity was subdued in June. However, many homeowners with higher rates - particularly those who closed on their mortgage in the last 12 to 18 months - jumped at the opportunity to refinance, even for a small reduction in monthly payments. This behavior speaks to the ongoing inventory and affordability challenges consumers are experiencing," said Brennan O'Connell, director of data solutions at Optimal Blue. "As we look toward the back half of 2024 and the potential for rate relief from the Fed, purchase lock counts will provide insight into if and when production will turn the corner."

Key findings from the Market Advantage report, which are drawn from direct-source mortgage lock data are:

* Small dip in interest rates: The benchmark OBMMI 30-year conforming rate bottomed out on June 13 at 6.810% before ending the month at 6.938%, 8 bps lower than the close of May. The retreat in mortgage rates prompted a 39% MoM increase in rate-and-term refinance volume.

* Year-over-Year purchase lock counts fall: After showing a YoY increase in April, purchase lock counts - a key measure for market health that excludes the impact of home price appreciation (HPA) and volatile refinance activity - have been down for two consecutive months this spring, falling 4% YoY in May and 8% YoY in June.

* Lethargic volume despite jump in refis: Total volume was up 2% over the previous month, an incremental increase driven by a 22% jump in refinance activity[1][BO2]. Purchase volume declined by 1% over the same time period.

* Credit remains high, but varies by locale: While average credit scores remained high across the board at 738, they varied widely among the top 20 metropolitan statistical areas (MSAs) by lock volume. The San Francisco-Oakland-Hayward MSA had the highest average credit score at 757, while Atlanta-Sandy Springs-Roswell, GA, had the lowest.

* Home prices drop for first time this year: The average home purchase price ended its five-month growth streak, dropping $1.5K, from $480.3K to $478.8K. MoM, the average loan amount declined by $300 to $374.2K.

The full June 2024 Market Advantage report provides more detailed findings and additional insights into U.S. mortgage market trends.

About the Market Advantage Report:

Formerly known as the Originations Market Monitor, Optimal Blue issues the Market Advantage mortgage data report each month to provide early insight into U.S. mortgage trends. Leveraging lender rate lock data from the Optimal Blue PPE - the mortgage industry's most widely used product, pricing, and eligibility engine - the Market Advantage provides a view of early-stage origination activity. Unlike self-reported survey data, mortgage lock data is direct-source data that accurately reflects the in-process loans in lenders' pipelines.

Nothing herein shall be construed as, nor is Optimal Blue providing, any legal, trading, hedging, or financial advice.

About Optimal Blue

Optimal Blue effectively bridges the primary and secondary mortgage markets to deliver the industry's only end-to-end capital markets platform. The company helps lenders of all sizes and scopes operate profitably and efficiently so they can fulfill the momentous role of helping American borrowers achieve the dream of homeownership, regardless of market dynamics. Through innovative technology, a network of interconnectivity, rich data insights, and expertise gathered over more than 20 years, Optimal Blue is an experienced partner that allows lenders to optimize their advantage from pricing accuracy to margin protection, and every step in between. To learn more, visit OptimalBlue.com.

News from Optimal Blue

Optimal Blue today released its June 2024 Market Advantage mortgage data report, which revealed a stagnant late-spring housing market as home prices dropped for the first time in 2024 and purchase lock counts fell 8% over the previous year. All mortgage lock figures in this news release have been controlled for fewer market days in June.

Related link: https://www2.optimalblue.com/

This version of news story was published on ScoopCloud™ (ScoopCloud.com) - part of and © the Neotrope® News Network - all rights reserved.

Mortgage Interest Rate Sensitivity Triggers 25% Spike in May Rate-and-Term Refinance Activity

PLANO, Texas /ScoopCloud/ -- Optimal Blue today released its May 2024 Market Advantage mortgage data report, which revealed a 25.6% month-over-month (MoM) spike in rate-and-term mortgage refinances. The spike was a response to a modest drop in the Optimal Blue Mortgage Market Indices (OBMMI) 30-year conforming rate, which ended the month at 7.02%.

"The sharp increase in demand for rate-and-term refinances following a dip in rates indicates that homeowners with rates above 7% feel pinched and are sensitive to even modest interest rate movements in the current economic landscape," said Brennan O'Connell, director of data solutions at Optimal Blue. "For context, since Optimal Blue began tracking the 30-year conforming rate as a market index in January 2017, interest rates only exceeded 7.02% on 120 market days. Based on other measures, buyers who locked loans on those days have the highest mortgage rates of the past two decades."

Key findings from the May 2024 Market Advantage report, which are drawn from direct-source mortgage lock data, include:

* Shallow dip in interest rates: The benchmark OBMMI 30-year conforming rate bottomed out on May 15 at 6.875% before ending the month at 7.02%, 22 bps lower than at the close of April. This reprieve in mortgage rates prompted a 25.6% MoM increase in rate-and-term refinance volume.

* Overall volume increase: Total volume rose by 5.3% MoM and 1.8% year-over-year (YoY), driven by a 4.1% increase in MoM purchase lock volume, a 7.2% rise in cash-out refinances, and a substantial 25.6% increase in rate-and-term refinances.

* YoY decline in purchase lock counts: Purchase lock counts, a key market health indicator that controls for home price appreciation and refinance volatility, were down 4% YoY. Despite the decline, May YoY purchase lock counts were stronger than the 7% YoY decline recorded in February, the last month unimpacted by the timing of the Easter holiday.

* Coastal market growth: Major coastal cities saw the highest MoM volume increases, with East Coast cities New York, Boston, and Jacksonville and West Coast cities Riverside-San Bernardino, San Diego, Sacramento, and Portland each seeing volume gains of 13% or greater.

* Stable, high credit quality: Average credit scores remained high, with the purchase borrower score averaging 738.

* Stable loan amounts, rising home prices: MoM, the average loan amount remained flat at $374.5K. MoM, the average home purchase price rose for the fifth consecutive month this year, up $2.4K from $477.9K to $480.3K.

The full May 2024 Market Advantage report provides further detail on these findings and more insights into U.S. mortgage market trends.

View report: https://www2.optimalblue.com/wp-content/uploads/2024/06/OB_MarketAdvantage_May2024_Report.pdf

About the Market Advantage Report:

Formerly known as the Originations Market Monitor, Optimal Blue issues the Market Advantage mortgage data report each month to provide early insight into U.S. mortgage trends. Leveraging lender rate lock data from the Optimal Blue PPE - the mortgage industry's most widely used product, pricing, and eligibility engine - the Market Advantage provides a view of early-stage origination activity. Unlike self-reported survey data, mortgage lock data is direct-source data that accurately reflects the in-process loans in lenders' pipelines.

Nothing herein shall be construed as, nor is Optimal Blue providing, any legal, trading, hedging, or financial advice.

About Optimal Blue:

Optimal Blue effectively bridges the primary and secondary mortgage markets to deliver the industry's only end-to-end capital markets platform. The company helps lenders of all sizes and scopes operate profitably and efficiently so they can fulfill the momentous role of helping American borrowers achieve the dream of homeownership, regardless of market dynamics. Through innovative technology, a network of interconnectivity, rich data insights, and expertise gathered over more than 20 years, Optimal Blue is an experienced partner that allows lenders to optimize their advantage from pricing accuracy to margin protection, and every step in between. To learn more, visit https://OptimalBlue.com/.

News from Optimal Blue

Optimal Blue today released its May 2024 Market Advantage mortgage data report, which revealed a 25.6% month-over-month (MoM) spike in rate-and-term mortgage refinances. The spike was a response to a modest drop in the Optimal Blue Mortgage Market Indices (OBMMI) 30-year conforming rate, which ended the month at 7.02%.

Related link: https://www2.optimalblue.com/

This version of news story was published on ScoopCloud™ (ScoopCloud.com) - part of and © the Neotrope® News Network - all rights reserved.